Estimating sea ice thickness is essential to monitor the effects of long-term climatic change and understand their consequences for Arctic ecosystems.
The continued sea ice loss – widely observed through EO data since 1979 – is bringing to an increased Arctic maritime activity for which timely forecasts of ice conditions are required too, to ensure safe passage and cost-effective planning.
In recent decades, advancements in satellite altimetry have enabled sea ice thickness to be estimated from space. This is achieved by measuring the sea ice freeboard; that is, the height of the sea ice surface relative to the adjacent ocean, and converting it to thickness by assuming hydrostatic equilibrium and bulk values of the ice, ocean, and overlying snow densities – and also snow depth.
Improved temporal coverage through merging of CryoSat-2 and Sentinel-3 products
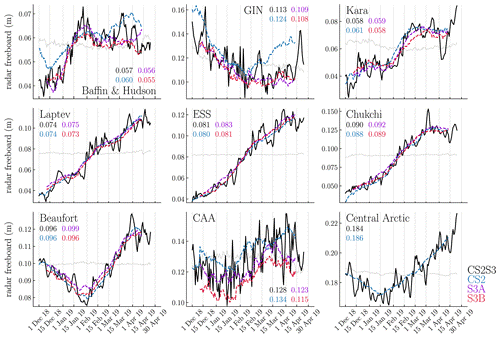
To date, due to repeat cycles, either using CryoSat-2 radar altimeter, or ICESat-2 laser altimeter or Sentinel-3A/B, the maximum temporal resolution achieved for pan-Arctic freeboard measurement from one satellite alone is 1 month.
This poses a significant limitation on the ability to both understand physical processes that occur on sub-monthly timescales and on capturing the temporal variability of sea ice thickness, which could provide information on sea ice forecasts.
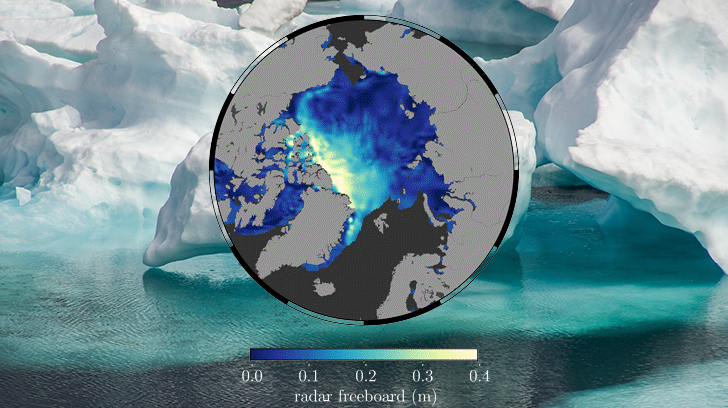
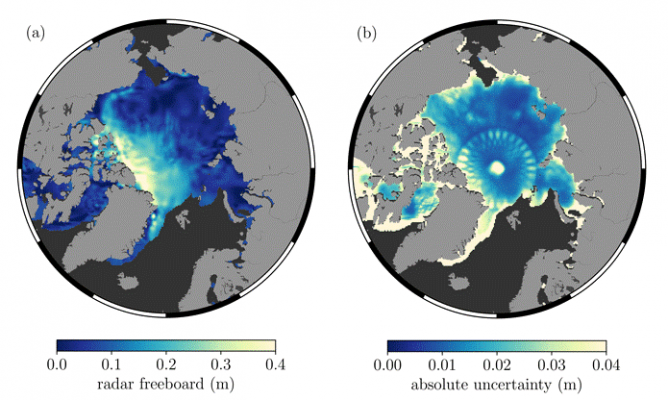
A study, recently published in The Cryosphere, demonstrates how a daily gridded pan-Arctic freeboard product can be obtained by applying a Bayesian inference technique (Gaussian process regression) to CryoSat-2, Sentinel-3A and Sentinel-3B combined radar freeboards.
The radar freeboard (the height of the radar scattering horizon above the local sea surface) is distinct from sea ice freeboard (the height of the snow–ice interface above the local sea surface). To convert radar freeboard to sea ice freeboard, a priori information on snow depth, density, and radar penetration depth are required so the study focused solely on radar freeboard so as not to impose new sources of uncertainty.
Interesting results asking for further research and development
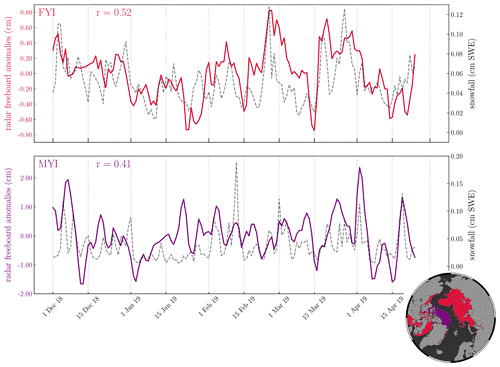
Temporal variability of the daily gridded pan-Arctic freeboard product was also compared to daily ERA5 snowfall data. Despite expectations, radar freeboard appears to be correlated to snowfall rather than showing a decrease with increasing snowfall, challenging the conventional assumptions of full snow penetration at Ku-band frequency and calling for further investigation to study the specific drivers.
Daily CryoSat-2 / Sentinel-3 radar freeboards at 25×25 km resolution are planned to be open access, made available as soon as processed.
The code and data files (already available for the period December 2018 to April 2019) for the optimised and quick-look daily radar freeboards (with uncertainty estimates) can be found in the GitHub repository.
This study was the outcome of a number of projects, including Polar+ Snow on sea ice.
Gregory, W. and Lawrence, I. R. and Tsamados, M., A Bayesian approach towards daily pan-Arctic sea ice freeboard estimates from combined CryoSat-2 and Sentinel-3 satellite observations, The Cryosphere, 15, 2021, 6, p.2857-2871, https://doi.org/10.5194/tc-15-2857-2021