A strong earthquake of Mw 7.1 struck southern California, United States on July 6, 2019 preceded by another earthquake of Mw 6.4 on July 4. This was the strongest earthquake in California since the 1999 Mw 7.1 Hector Mine earthquake. The earthquake sequence took place on a remote and sparsely inhabited area of California, limiting the effects on structural damages in the nearby settlements of Ridgecrest, Trona and China Lake Naval Station.
The arid and desert environment of California offered excellent conditions for satellite observations. Due to the short revisit frequency of the Copernicus Sentinel-1 and -2 satellites, numerous images were acquired before and during this earthquake sequence. This offers valuable data to monitor the ground deformation and map the faults involved in the rupture. Combined with other type of data (eg. seismic), a model of the earthquakes’ rupture can be derived helping the scientist to understand the mechanism of earthquakes and the California faults system. Dr. Sotiris Valkaniotis, an earthquake geologist collaborating with Geodynamic Institute NOA & Corinth Rift Laboratory conducted this type of analysis using Copernicus Sentinel-1 radar images and Copernicus Sentinel-2 optical images from before and after the earthquake sequence.
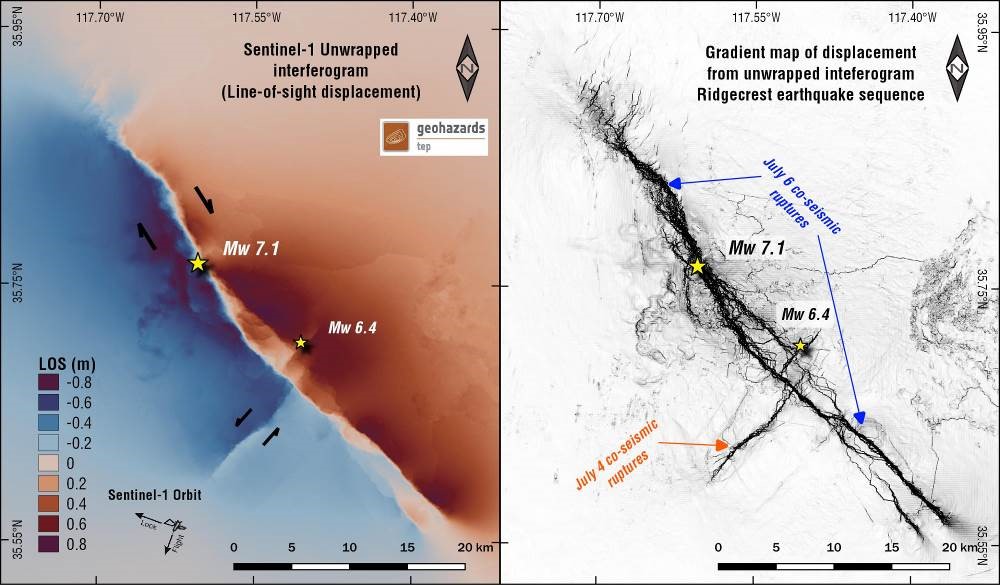
Measuring vertical ground motion with Sentinel-1
Dr. Valkaniotis computed interferograms which provide a measure of the ground deformation from the phase difference of the electromagnetic wave sent by the satellite between two acquisitions. This technique is mostly sensitive to vertical ground motion and, in optimal conditions, provides measurements of the deformation with millimetric accuracy. This analysis was performed on the cloud processing ESA’s Geohazards Exploitation Platform (GEP) using the SNAP Toolbox of ESA and the DIAPASON processor of CNES with Copernicus Sentinel-1 radar images.
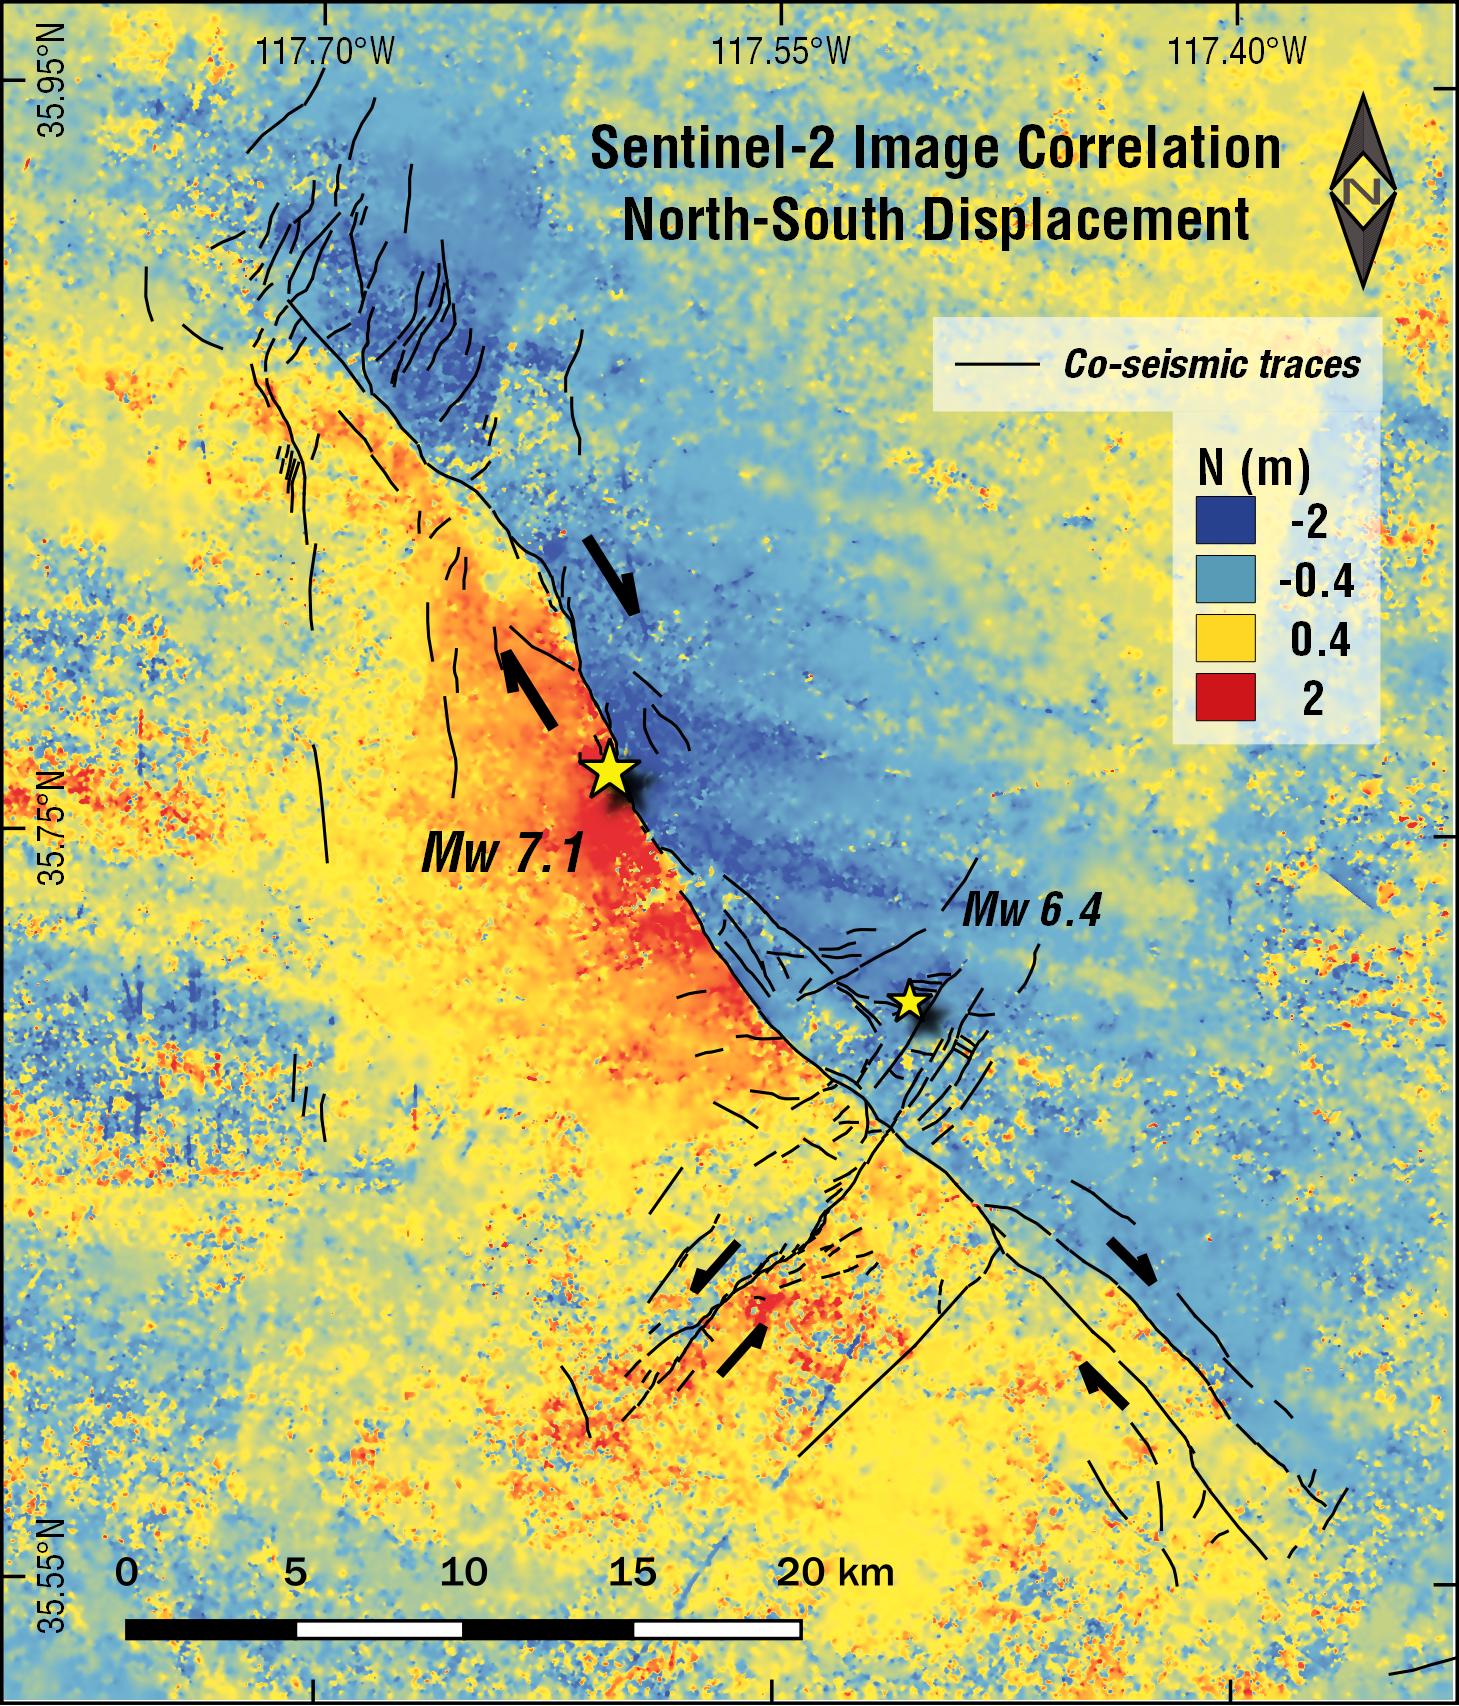
Measuring horizontal ground deformations with Sentinel-2
Subpixel correlation of optical images from the Copernicus Sentinel-2 mission was also computed in order to extract horizontal ground deformation. The principle of this method consists in detecting the same pixel in the image acquired before and after the earthquake and measuring the horizontal displacement between the two positions. This was automatically performed with the open-source MicMac software of the French IGN and the MPIC-OPT service of CNRS EOST available on the GEP.
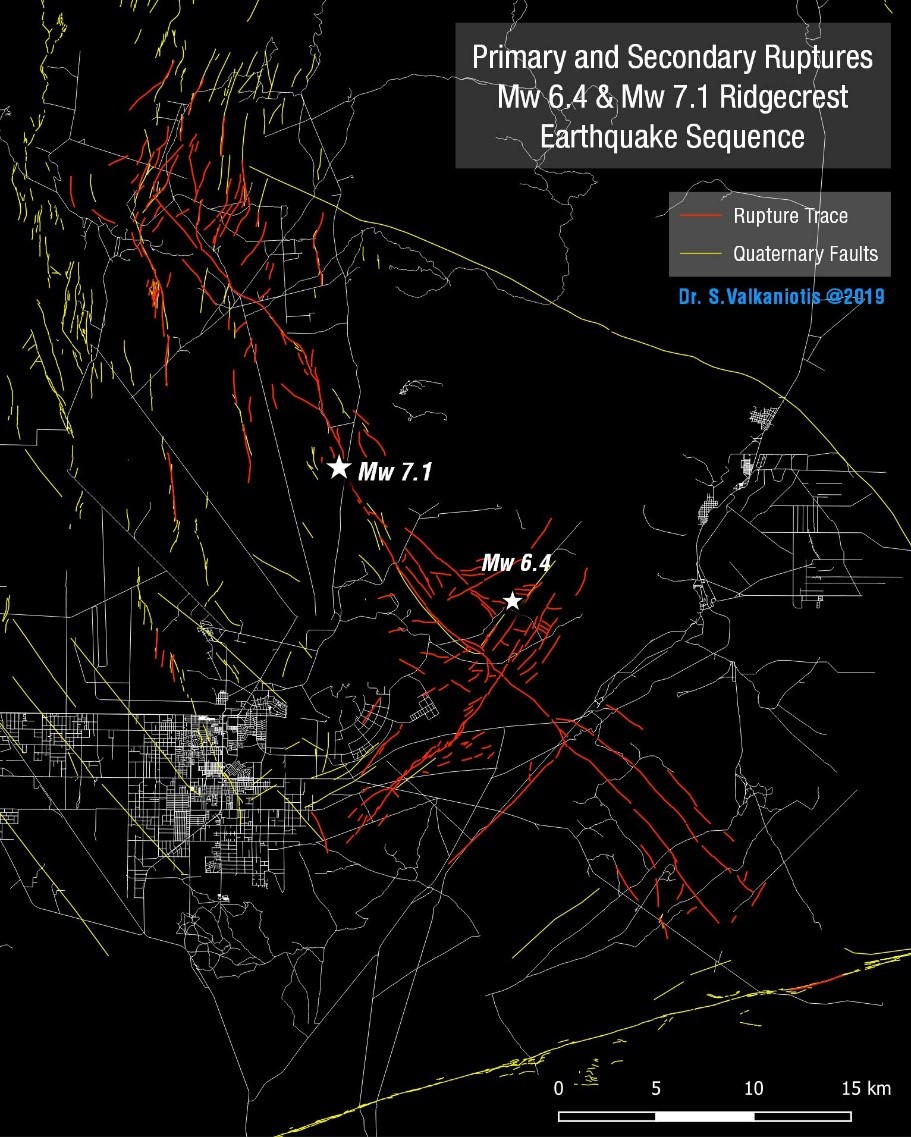
The full picture: detecting new faults
The results show a clear ground displacement in both optical and radar processing with horizontal offsets of 1 to 1.5m and vertical motion of less than 1 meter. Surface ruptures were identified and mapped using interferograms and derived products (eg. gradient), optical offsets and change detection analysis on optical images. All these datasets are consistent one with another and show a complex pattern of co-seismic surface ruptures of NW-SE and NE-SW orientation. This illustrates the ability of two independent satellite missions of the Copernicus programme: accurately observing the terrain motion pattern with complementary information from each satellite sensor is key to the geohazard community.
A large number of the faults mapped by satellite were validated in the field by US geologists conducting post-earthquake surveys in the area. Although some parts of the July 4 – July 6 faults were previously mapped in the Quaternary Fault and Fold database of the US Geological Survey, the presence of a major earthquake fault source had not been identified up to now in this area.
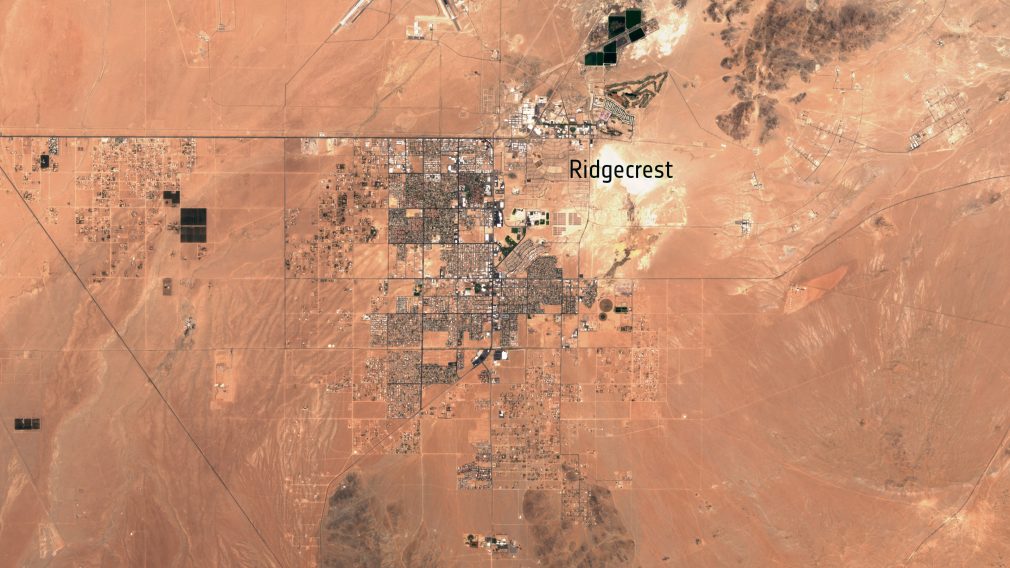
Featured image : Sentinel-2 acquisition centred on Ridgecrest, California, where most structural damages to settlements took place. Contains modified Copernicus Sentinel data (2019)