A recent study provides maps of man-made carbon dioxide anomalies around the globe.
Carbon dioxide (CO2) is the most important anthropogenic greenhouse gas and its increase in the atmosphere is responsible for the global warming. CO2 is emitted into the atmosphere by the burning of fossil fuels. Satellite-based observations provide information on the concentration of carbon dioxide (i.e., column-averaged CO2 dry air mole fraction, XCO2) around the globe.
Because of its long lifetime, carbon dioxide increases in the atmosphere and gets transported by the winds very far from the emission sources.
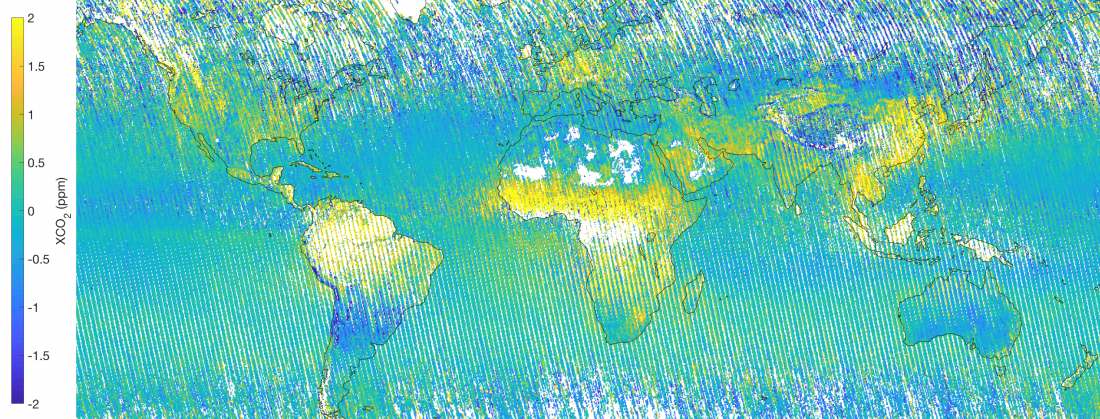
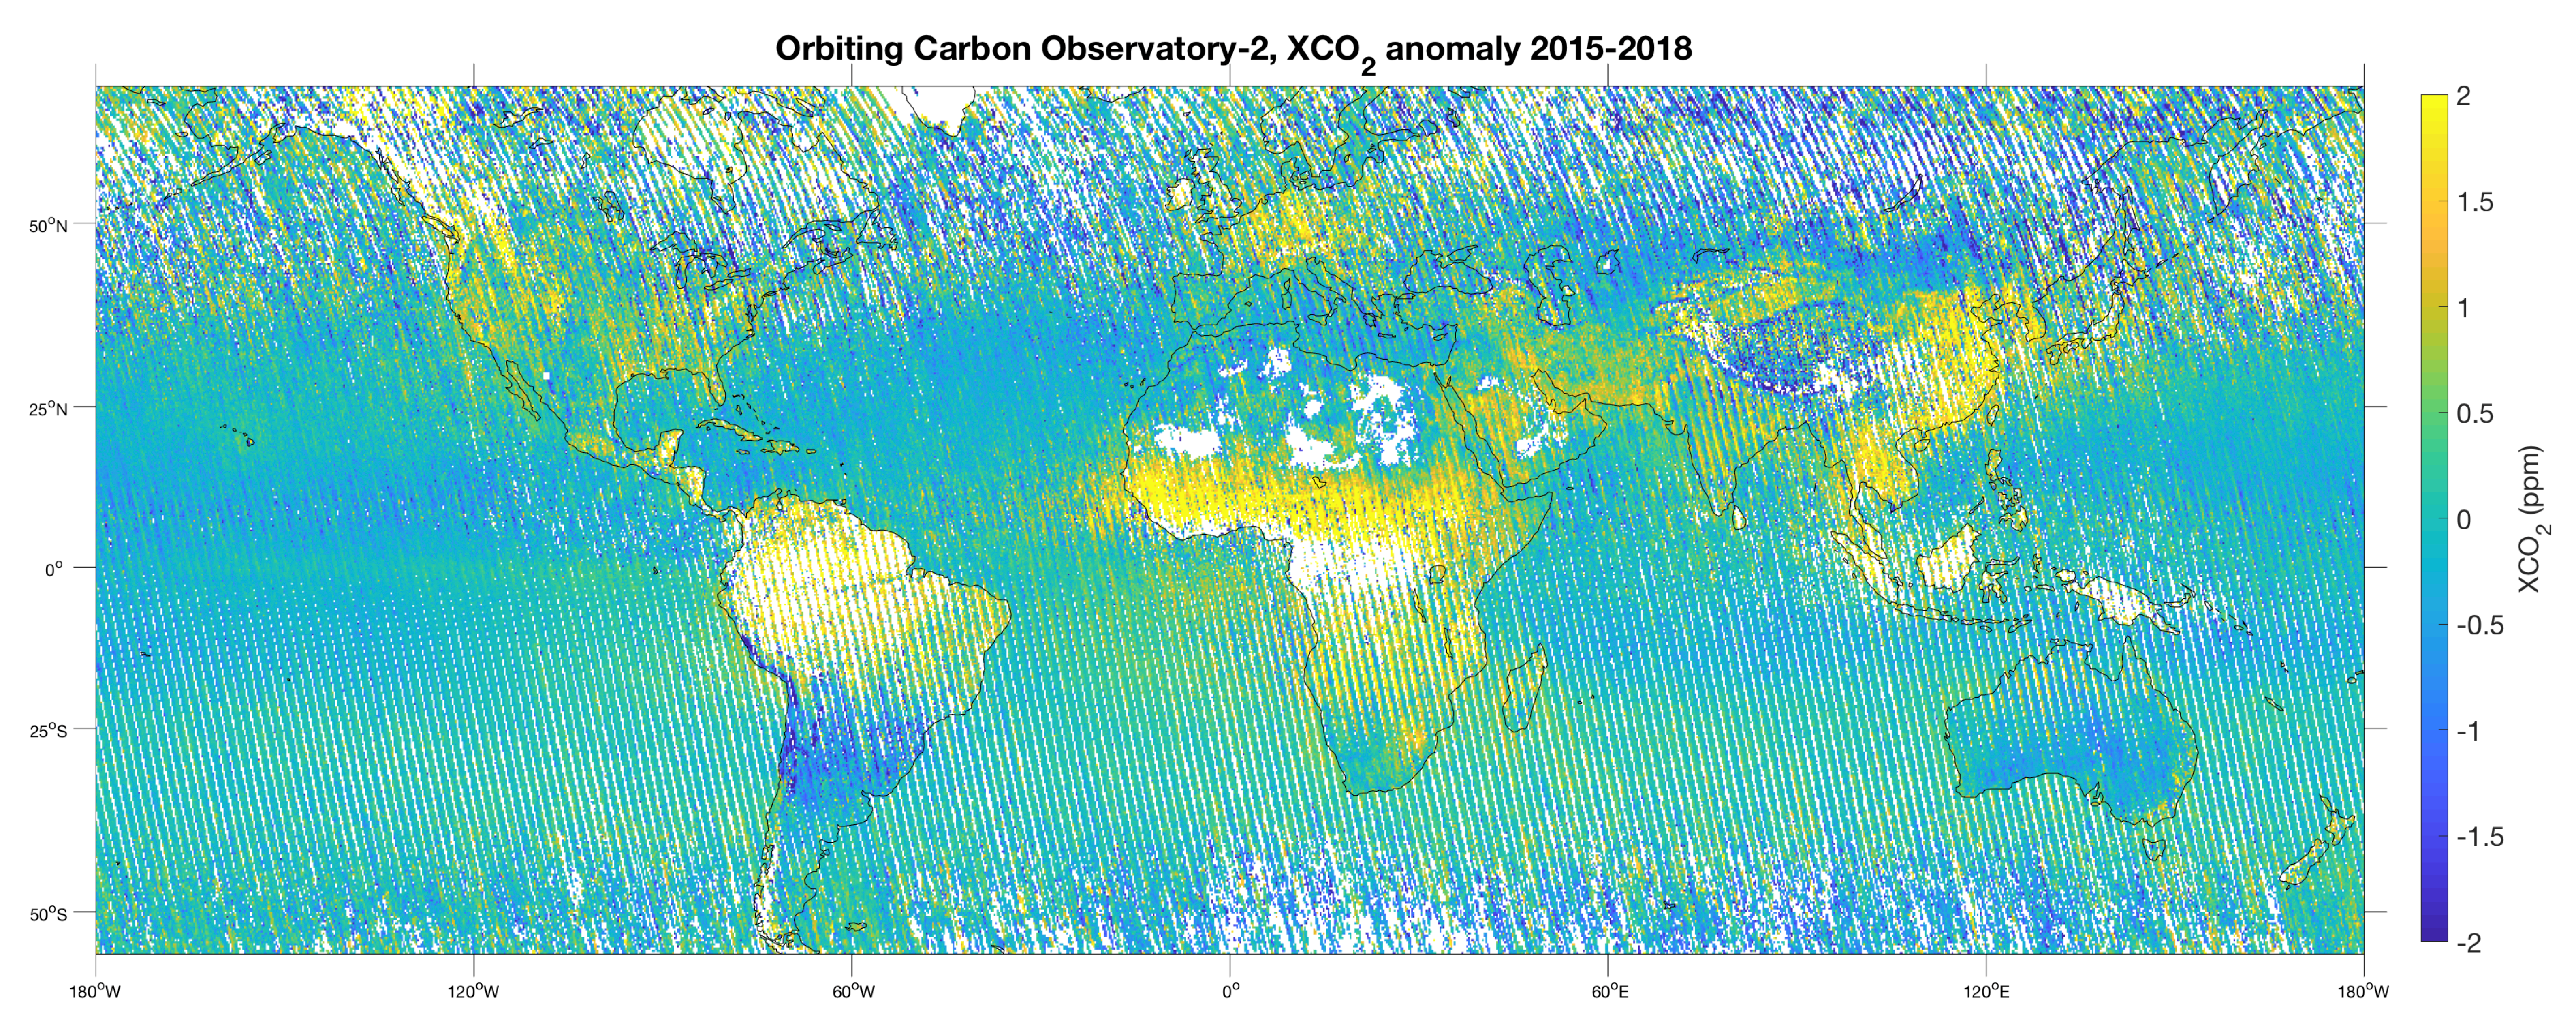
A recent study introduced the concept of XCO2 anomaly (i.e. the difference from the daily background over a certain area), which provides maps of the distribution of the CO2 emission areas worldwide.
Janne Hakkarainen, from the Finnish Meteorological Institute (FMI), comments: “The map shows positive XCO2 anomaly over the major industrial areas: China, eastern USA, central Europe, India, and the Highveld region in South Africa. Also, we find positive anomalies over biomass burning areas (for example in Africa and Indochina) during different fire seasons. On the other hand, the largest negative anomalies correspond to the growing season in the middle latitudes”. The anomaly maps are based on the observations collected by the NASA’s OCO-2 (Orbiting Carbon Observatory-2) mission, which began operating in September 2014.
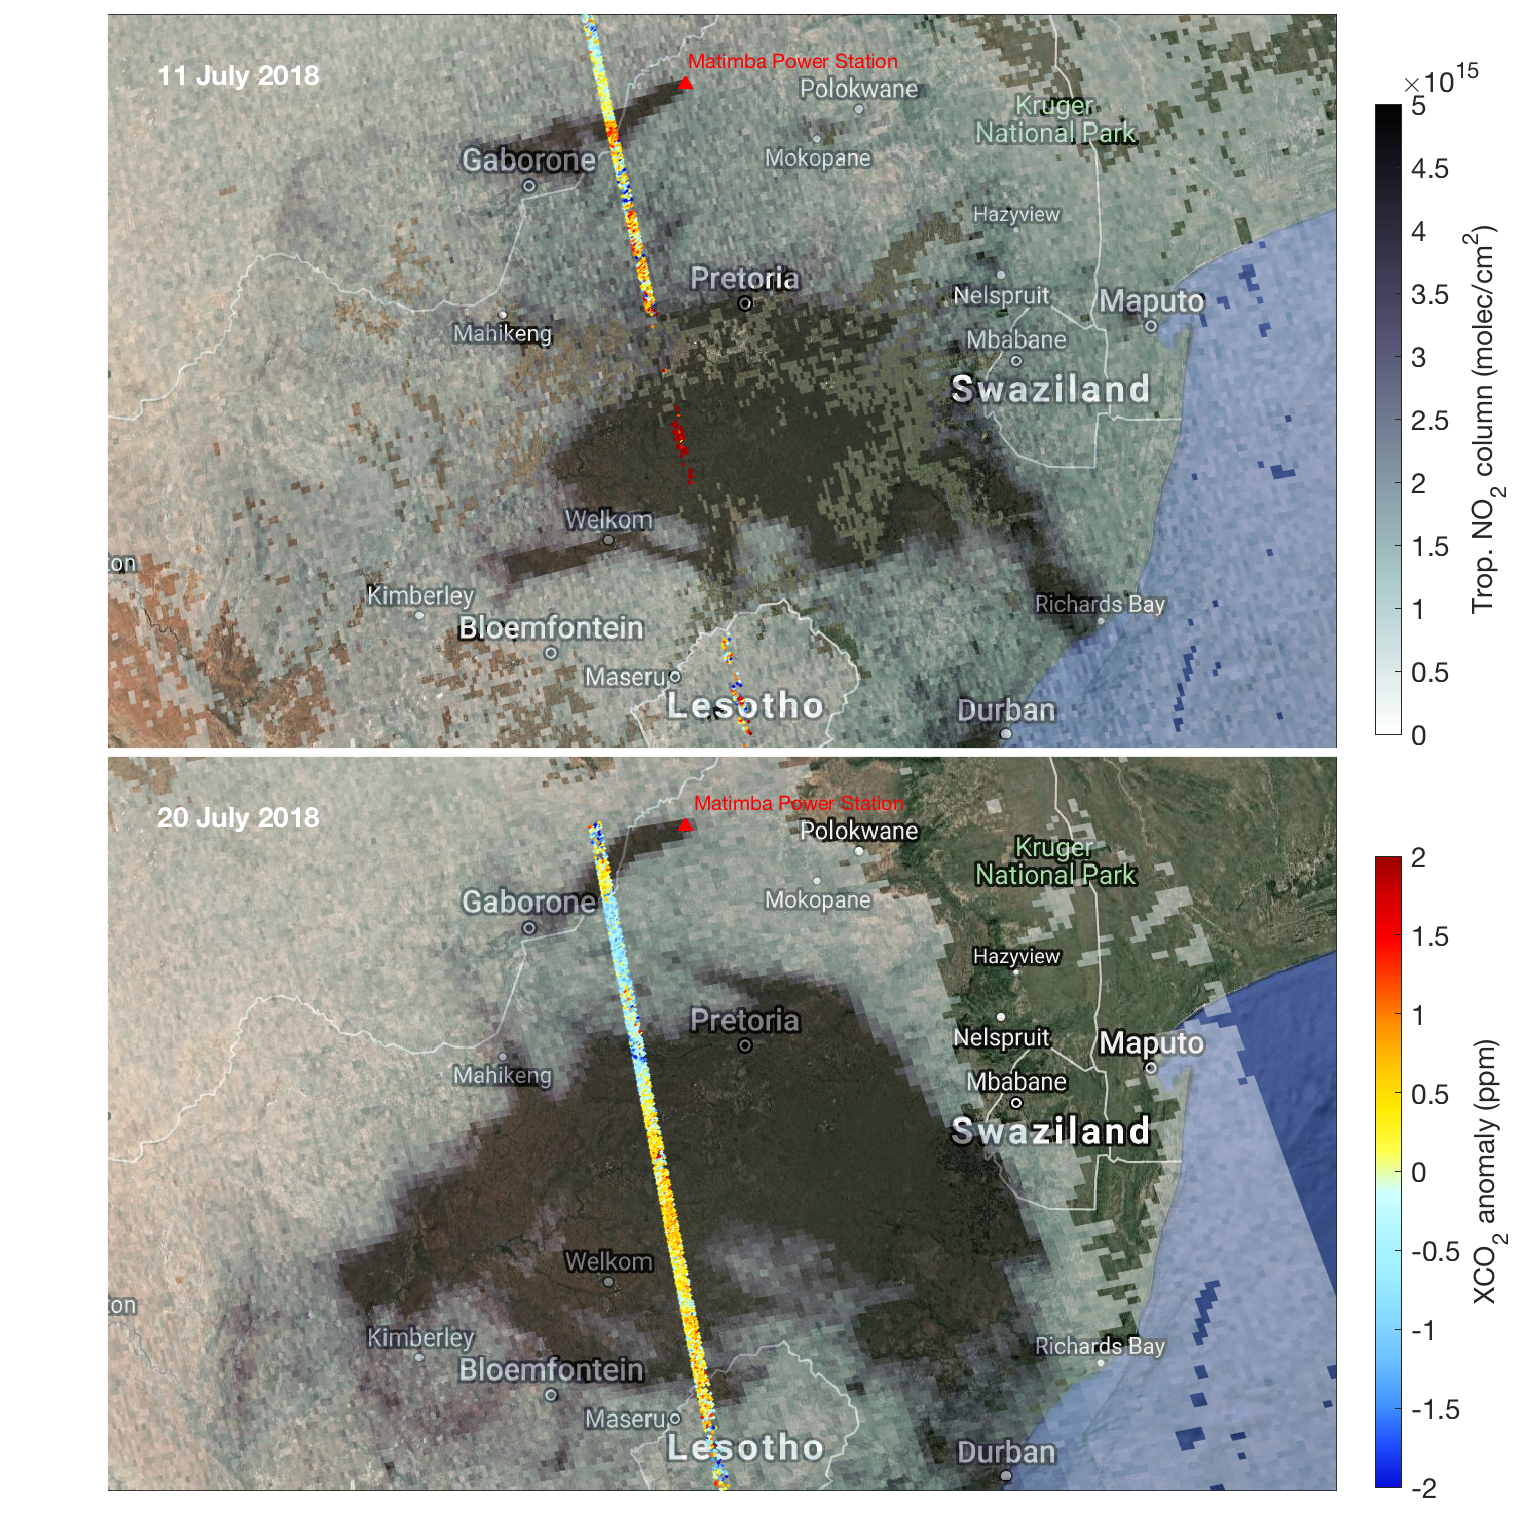
Comparing the XCO2 anomaly maps to short-lived polluting gases, such as nitrogen dioxide (NO2) observations derived from the Copernicus Sentinel-5P’s TROPOMI (TROPOspheric Monitoring Instrument), provides further insights on the spatial patterns of the carbon dioxide emission sources.
“Using NO2 concentrations as indicator of anthropogenic fossil fuel combustion, helps in identifying anthropogenic XCO2 enhancement as visible, for example, over the Highveld region in South Africa,” continues Hakkarainen.

“Satellite observations available with such detail open new opportunities for societal applications, including urban and industrial emission monitoring. For example, satellite observations have been already used in the cleantech sector in order to evaluate the efficacy of their technology in reducing polluting emissions from metal smelting”, comments Iolanda Ialongo, from the Finnish Meteorological Institute. “Future greenhouse gas missions should be designed with a wider coverage than what is currently available, in order to improve the capabilities of monitoring man-made CO2 emissions”.
The results are achieved within the DACES project, which focuses on detecting anthropogenic CO2 emissions sources by exploiting the synergy between satellite-based observations of short-lived polluting gases (such as NO2) and greenhouse gases.
The full publication by Hakkarainen and co-authors can be found at the following link: https://www.mdpi.com/2072-4292/11/7/850


