How does the pandemic affect shipping traffic and related air and water quality?
The COVID19 pandemic strongly affected global logistics and supply chains which primarily rely on shipping for moving goods and commodities around the globe.
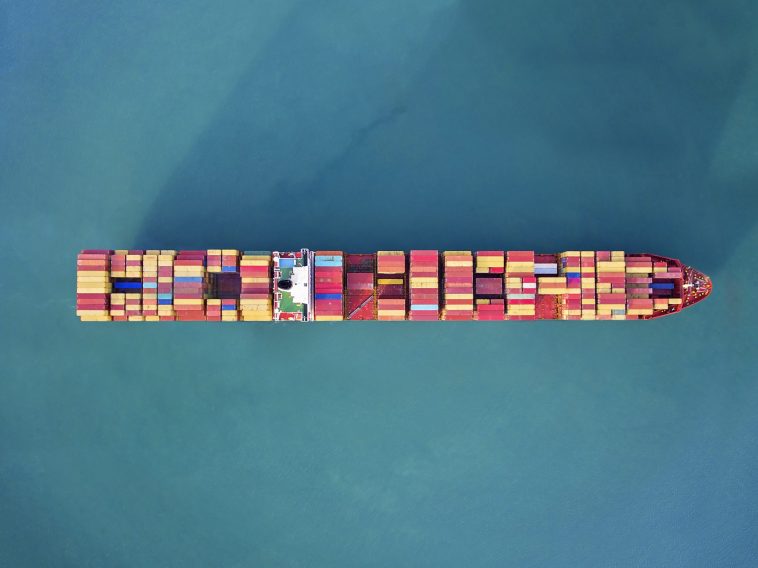
Reduced demand for crude oil, a consequence of drastic reductions in transportation, led to queues of oil tankers in front of the main oil storage facilities; reduced demand for different commodities resulted in clear reductions in the number of shipping vessels in commercial harbours.
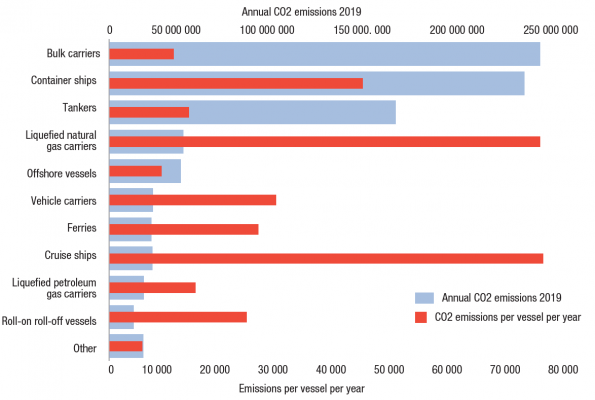
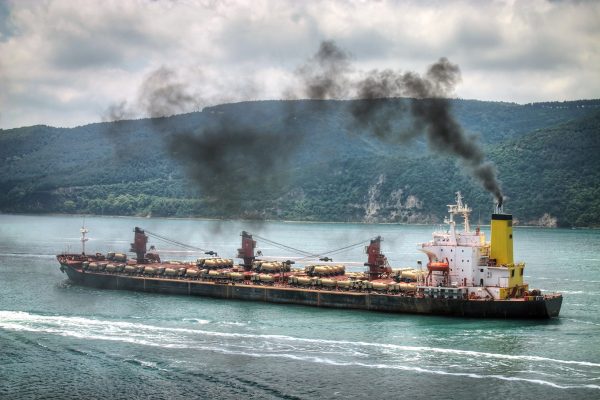
Ship traffic is often criticised for its contribution to air pollution due to the use of heavy diesel engines causing emissions of pollutants such as carbon dioxide (CO2), nitrogen oxides (NOx), sulphur oxides (SOx) and particulate matter.
It also strongly impacts the marine environment (oil release, ballast water release, surface layer mixing, physical disturbance, introduction of marine alien species, etc.).
Challenge objectives
Everyone is invited to propose and develop innovative, integrated ways to characterise shipping vessel dynamics, atmospheric parameters and ocean water quality by use of EO-based and interdisciplinary data available in the RACE dashboard and the Euro Data Cube.
Keep in mind that within the RACE initiative, we primarily focus on Europe and the relevant impacts of the pandemic on the European environment, economy and society.
Available input datasets
We invite you to consider the following key datasets, available in the RACE dashboard and the Euro Data Cube environment:
Please note that none of these datasets are mandatory to be used, but innovative and integrated use of multiple EO and other datasets might be considered positive during evaluations.
There is also a possibility to incorporate additional datasets to support your analysis. For this there is tutorial material available explaining the Bring Your Own Data (BYOD) mechanism in Euro Data Cube and in for the ingestion of user defined data into GeoDB.
Beyond this, we encourage you to think of good ways to make use of the interdisciplinary data in the RACE dashboard and the Euro Data Cube environment: be innovative and creative, of course always keeping scientific integrity in mind!
Sample questions that your analysis might address
Questions relevant in this context that your analysis could address:
- How have shipping dynamics along major shipping routes developed during the pandemic and in comparison to pre-pandemic years?
- Are there are discernible patterns between shipping dynamics and the observations from the Sentinels or the CMEMS marine products?
- What is the effect of changing shipping dynamics on air quality parameters observed by Sentinel-5 TROPOMI and CAMS air quality data?
- How can CAMS and S5P values be used in a complementary approach to better quantify the relationship between ship traffic and air quality?
How to participate
You may find a detailed overview of the RACE dashboard challenges 2021 and instructions on how to participate in the announcement.
This explains also the evaluation criteria that we will follow during the review of your contribution.
For this first stage of the challenge, the Euro Data Cube provides you kindly with a tailored trial account, this will allow you to:
- Host and preconfigure Juypter notebooks for interactive development of your contribution to this challenge
- Access relevant EO and non EO datasets currently in the RACE dashboard
- Access existing indicators in the RACE dashboard via the Euro Data Cube GeoDB
- Access tutorial notebooks and help articles of how to best make use of the Euro Data Cube technologies in an effective way.
Sign-up for the challenge on this page. After signing-up you will receive an email from Euro Data Cube with tailored instructions.
For any query, please refer to the following e-mail addresses:
- all technical issues – racecontest@eurodatacube.com
- more general questions – eodash@esa.int
Don’t forget that
This first challenge will stay open for one month and close on 31/03/2021 at midnight CET.
By then you are expected to submit within the Euro Data Cube environment your results which should include:
- Juypter notebook with your prototype analysis, executable within Euro Data Cube. This should contain the analysis workflow and required functionality but should also provide some visualisation of derived results and some description and explanations of what you are doing in the overall workflow;
- Presentation with a summary of your results, addressing the following sections: Background, Objectives, Approach, Methods, Implementation and Results;
- One page proposal for your upscaling plans: explain to us how you would upscale your analysis for Stage 2 of this challenge to a European coverage and expanded time frame, to allow for continent scale impact assessment.
Please also send an email with links to the result documentation to: racecontest@eurodatacube.com
Useful links
- https://race.esa.int/
- https://eurodatacube.com/
- https://sentinel.esa.int/web/sentinel/user-guides/sentinel-1-sar/applications/maritime-monitoring
- https://labo.obs-mip.fr/multitemp/visualizing-shipping-lanes-from-sentinel-1/
- https://cockpit.hub.eox.at/storage/uploads/edc-editor/Euro_Data_Cube_summary_brochure.pdf
- https://docs.sentinel-hub.com/api/latest/data/sentinel-5p-l2/#available-bands-and-data
- https://docs.sentinel-hub.com/api/latest/data/sentinel-3-olci-l1b/