
How can EO contribute to monitoring and understanding the impacts of the pandemic on the economy and the environment?
Replying to this question has been the objective of the Rapid Action on COVID19 with Earth Observation (RACE) initiative since its launch, in spring 2020, by ESA and the European Commission (EC).
The investigation is ongoing and a new round of monthly challenges is starting on 2 March, open to anyone with innovative ideas to exploit the wealth of data available to discover some novel analytic approaches that allow improved understanding of pandemic-related processes in different aspects of society, economy and the environment.
Links to each challenge are regularly added at the end of this page.
The RACE dashboard
Outcomes of the investigation to date are readily available in the RACE dashboard, an ever growing display of indicators describing the status of different components in sectors such as economy, agriculture or air and water quality during the pandemic.
Besides data collected through a joint effort of industrial and academic partners, the dashboard features two indicators (truck and airplane traffic) that are the outcome of the COVID19 scripting contest conducted throughout 2020, upscaled at European level and integrated into the dashboard.
New dashboard challenges 2021
In analogy with the mentioned COVID19 scripting contest, a new round of challenges, with a largely revised format, is about to start, and outcomes will eventually enrich the RACE dashboard further.
A new challenge, based on a specific theme, will be launched throughout 2021 at the beginning of each month – starting from March – and stay open – for one month (from publication of the challenge). Each theme will look at interdisciplinary scenarios, in order to investigate how different components of the environment interact with pandemic-driven changes in people’s behaviour and different aspects of the economy.
The final goal of each challenge is the discovery and development of new indicators, contributed by the community, to be integrated into the RACE dashboard. Full credit and IPR stay with the developer, whose results will have high public visibility and this might be the start of a success story!
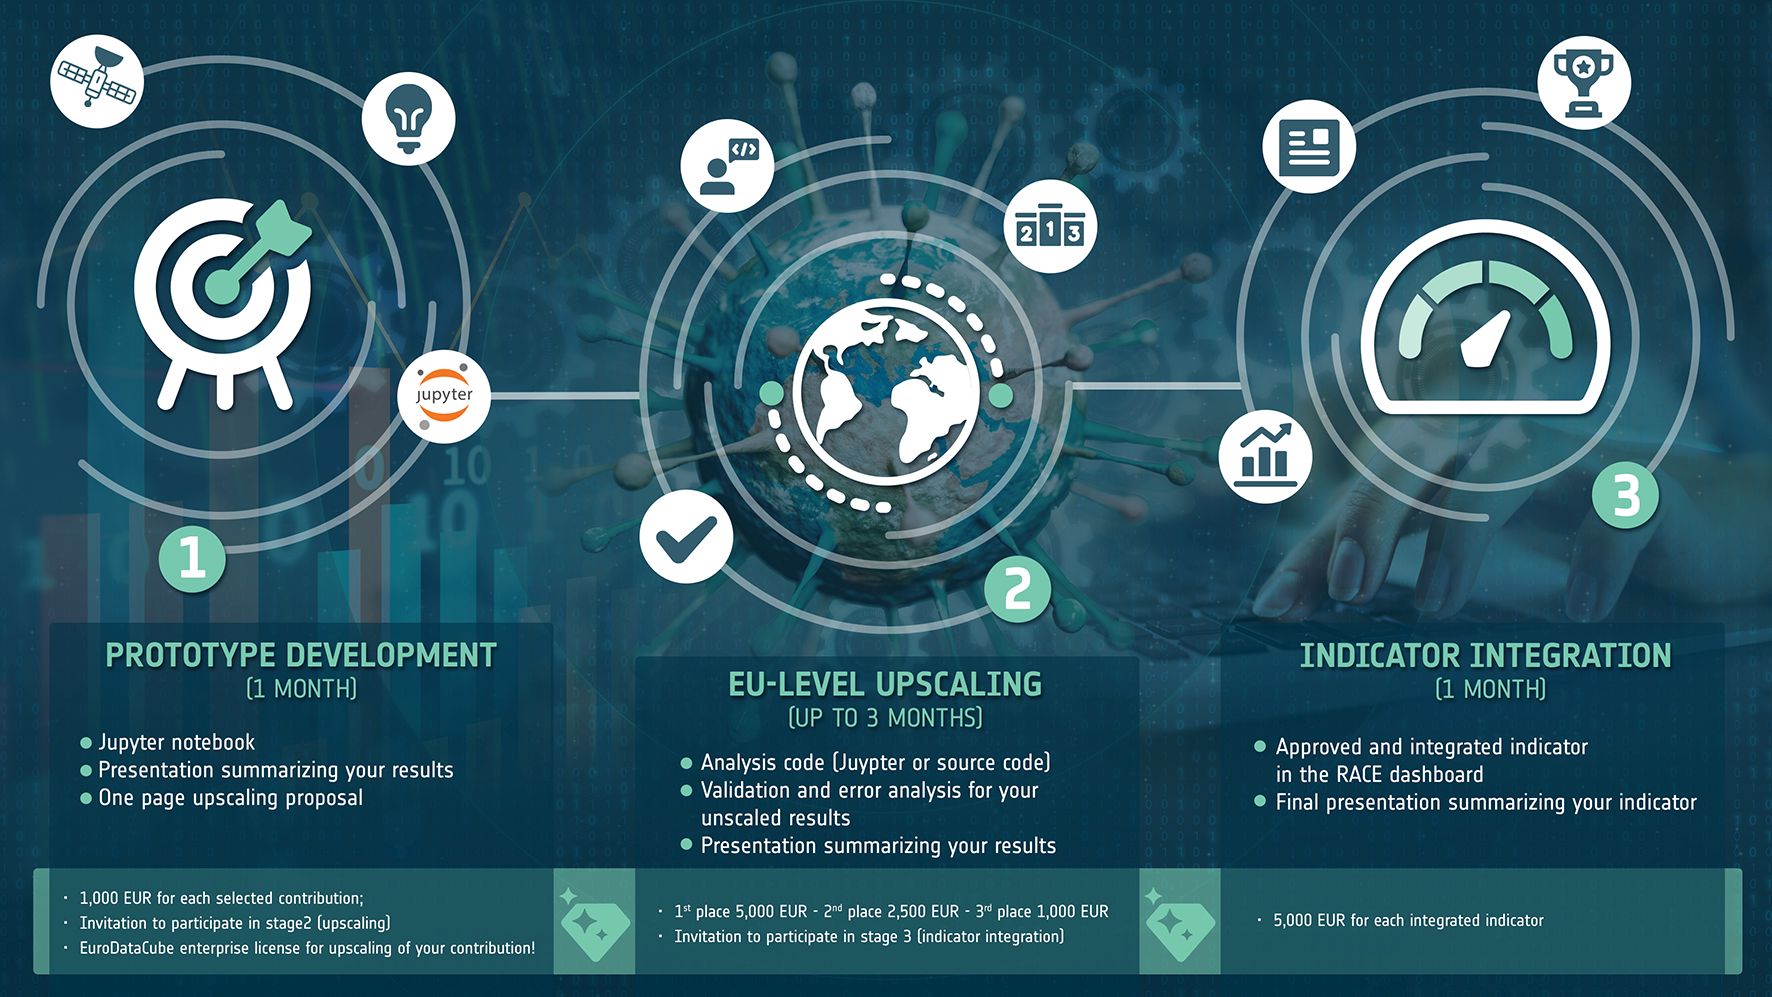
Stages for each monthly challenge
Technology and data
Hosted Jupyter notebooks in EuroDataCube will be the main technological interface for development, providing participants with intuitive access to the Sentinel data archives as well as the layers and indicators in the RACE dashboard.
Tutorial notebooks have been prepared to guide participants on how to access data, how to use GeoDB to store and retrieve indicator statistics and how to ingest additional datasets necessary for the analyses.
Evaluation
The following key criteria will be considered for the challenges during each stage of the evaluation:
- Innovation
- Cross Disciplinary Value
- Scientific integrity & validation
- Upscaling potential
- Joint use of EO and other datasets (e.g. Copernicus Services)
- Policy Relevance
How to participate
Sign-up for the challenge on this page. After signing-up you will receive an email from EuroDataCube with tailored instructions.
For any query, please refer to the following e-mail addresses:
- all technical issues – racecontest@eurodatacube.com
- more general questions – eodash@esa.int
Stay tuned and follow forthcoming news on eo4society.esa.int page, as well as the hashtags #race_dashboard_challenge and #eodash on social media (@EO_OPEN_SCIENCE and @ESA_EO Twitter accounts).