High-resolution images collected over a mixed forest ecosystem with the HyPlant sensor, deployed as an airborne demonstrator of the forthcoming ESA-FLEX satellite have been exploited in this study to explore the potential of a novel metric based on far-red sun-induced chlorophyll fluorescence (F760) to map the functional diversity of terrestrial ecosystems.
Plant functional diversity, defined as the range of plant chemical, physiological and structural properties within plants, is a key component of biodiversity which controls the ecosystem functioning and stability. Monitoring its variations across space and over time is critical in ecological studies.
Read about the study outcomes.
Marco Celesti is an ESA Living Planet Fellow leading the MULTI-FLEX project.
Giulia Tagliabue, Cinzia Panigada, Marco Celesti, Sergio Cogliati, Roberto Colombo, Mirco Migliavacca, Uwe Rascher, Duccio Rocchini, Dirk Schüttemeyer, Micol Rossini, “Sun–induced fluorescence heterogeneity as a measure of functional diversity”, Remote Sensing of Environment, 247, 15 September 2020; https://doi.org/10.1016/j.rse.2020.111934
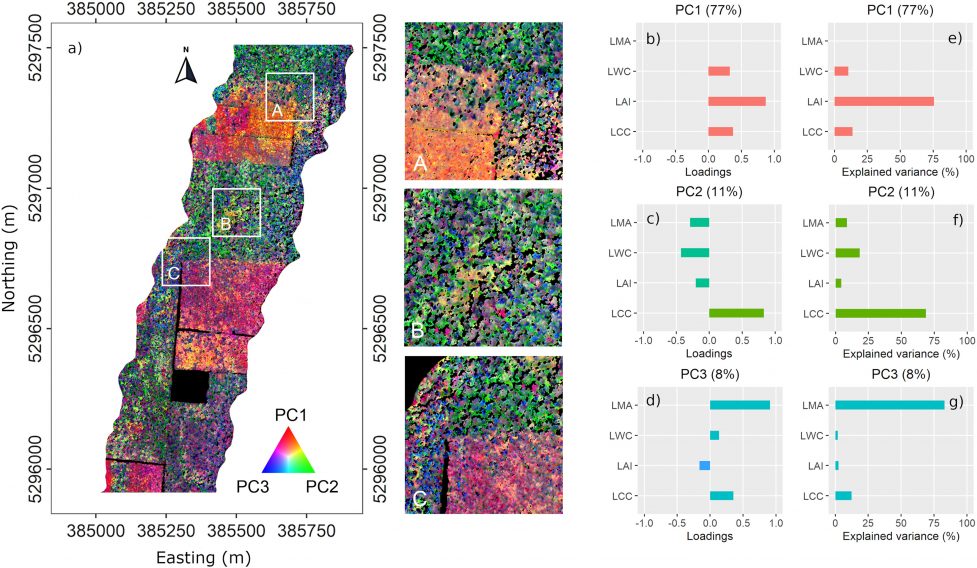
Featured image : a) RGB composite of the first three Principal Components (PCs) derived from the Principal Component Analysis performed on leaf chlorophyll content (LCC), leaf area index (LAI), leaf water content (LWC) and leaf mass per area (LMA) retrieved from the airborne hyperspectral images. The colours are the result of the combination of the first (PC1), second (PC2) and third (PC3) principal components in the R, G and B channels, respectively. The sub-regions marked with “A”, “B” and “C” (white squares) are representative of three different conditions encountered across the area. “A” marks an area at the edge between the regeneration and mature forest, where the managed plantation is characterised by high values in PC1 and PC2. “B” is a 100% mature forest area where the canopy is complexly structured. “C” marks a mixed regeneration/mature forest area where the regeneration stand presents high values in PC1 and PC3 and the mature stand has a different species composition compared to “A”. On the right, bar plots of the loadings of b) PC1, c) PC2 and d) PC3 and of the explained variance of e) PC1, f) PC2 and g) PC3.