GLOBEO (FR)
The world’s forests have undergone substantial changes in the last decades. Deforestation and forest degradation in particular, contribute greatly to these changes. In certain regions and countries, the changes have been more rapid, which is the case in the Greater Mekong sub-region recognized as deforestation hotspot. Effective tools are thus urgently needed to survey Illegal logging operations which cause widespread concern in the region.
Several research and government organizations have developed systems that provide regular updates to the public, principally based on satellite data. However, most monitoring approaches rely predominantly on optical remote sensing. Nevertheless, a major limitation for optical-based near real time applications is the presence of haze in the dry season (caused by fire) and, more importantly, of clouds persistent in the tropics during the wet season. Cloud cover free SAR images have great potential in tropical areas, but have rarely been used for forest loss monitoring compared to optical imagery. Yet, the dense time series of the Sentinel-1 constellation offer a unique opportunity to systematically monitor forests at the global scale. In addition, it has been recently demonstrated that forest losses can be monitored using Sentinel-1 dense time series based on reliable indicators that bypass environmental effects on SAR signals.
In this context, the primary science objective of the SOFT project is to provide near real time forest loss maps over Vietnam, Cambodia and Laos using Sentinel-1 data to the users of public sectors to support their efforts to control logging and log trade.
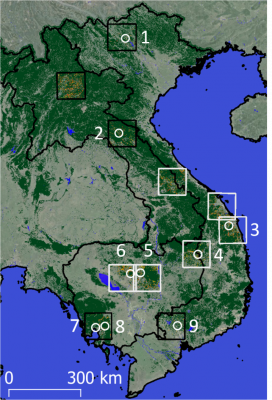
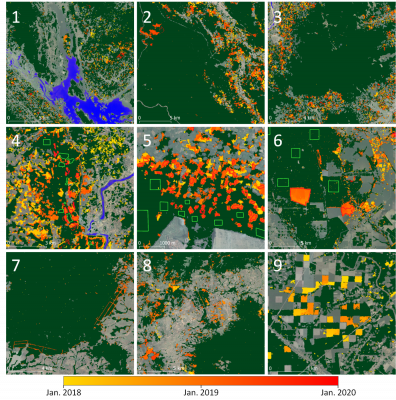
SAR-based Algorithms of forest loss detection were first adapted and tested over eleven test sites in the frame of the proof-of-concept (PoC) development. The forest loss detection method from Bouvet et al. (2018) was considered as the best potential candidate algorithms for the reasons detailed in the Final Report. Regarding the Sentinel-1 data processing, we used the pre-processing chain developed at CESBIO and CNES as an operational tool for Sentinel-1 GRD data processing. The chain is based on open source libraries and can be used freely. We selected an adapted forest definitions, selected the test sites and reference data for the PoC, which covered various landscapes and terrain slopes. We also selected relevant ancillary data such as a forest mask, the quality of which has a big impact on the final forest loss detection results. Using these dataset, we deeply analyzed the Sentinel-1 backscatter signal over forest loss and intact forest areas of Vietnam, Cambodia and Laos, which was needed to adapt the forest loss detection method. The quality of maps resulting from the PoC was analysed and assessed qualitatively and quantitatively.
The results of the PoC were extended to the whole Vietnam, Laos and Cambodia for the years 2018 to 2020. We optimized, installed and ran the scripts (in Python) onto the high performance computing (HPC) cluster of the CNES. Then, the processing of the whole study area has been achieved. We mosaicked the resulting maps, checked their quality and manually corrected outliers.
This led to the final map which is the main outcome of the SOFT project. The map provides clear hints of the spatial and temporal distribution of forest losses. For example, the difference between high forest losses currently happening in Northern Laos versus low forest losses in Northern Vietnam is clearly seen, although the whole Northern mountainous region is covered by similar forest types.
We also compared the forest loss surface areas obtained from our method with the results from GFW and GLAD. Although we do not consider the maps of GFW and GLAD as a benchmark and although the use of Sentinel-1 is basically much more relevant in term of timely detection of forest losses, we quantitatively compared the statistics per year and country and qualitatively compared both maps. The results from this study and from GFW are remarkably similar, the largest difference (23%) being found for Laos in 2019. This result highlights the fact that our detection system can be used as an alert system (fast detection from sentinel-1 data) and as an annual detection system similar to GFW, used for example to compute national statistics.
The final map was thoroughly validated following the recommandations from Olofsson (2014 and 2020). We chose as sampling design a stratification with stratas defined by the map classes, mainly to improve the precision of the accuracy and area estimates. We specified a target standard error for overall accuracy of 0.01 and supposed that user’s accuracies of the change class is 0.70 for forest disturbances and 0.90 for intact forest. The resulting sample size was therefore n=803 in total, which we have rounded up to 1 000 samples. We then assessed the allocation of the sample to strata so that the sample size allocation results in precise estimates of accuracy and area. We followed Olofsson’s recommendations and allocated a sample size of 100 for the forest disturbance stratum, and then allocated the remainder of the samples to the intact forest classes, i.e. 200 in the buffer areas around detected disturbances, and 700 in intact forest outside of these buffers. We used when possible freely accessible very high spatial resolution imagery online through Google Earth™, which presents low cost interpretation options. When Google Earth images were not available at the relevant dates, we instead accessed Planet’s very high-resolution analysis-ready mosaics as reference data. We then calculated the resulting confusion matrix presented in terms of the sample counts and the confusion matrix populated by estimated proportions of area, used to report accuracy results. The estimated user’s accuracy ( 95% confidence interval) is 0.95 for forest disturbances and 0.99 for intact forest (including buffer areas around disturbance) and the estimated producer’s accuracy is 0.90 for forest disturbances and 0.99 for intact forest. Finally, a quality assessment was performed by comparing the final map to existing optical-based products. The estimated area of 2018 and 2019 deforestation according to the reference data was 23 437 +/- 2 140 km2.