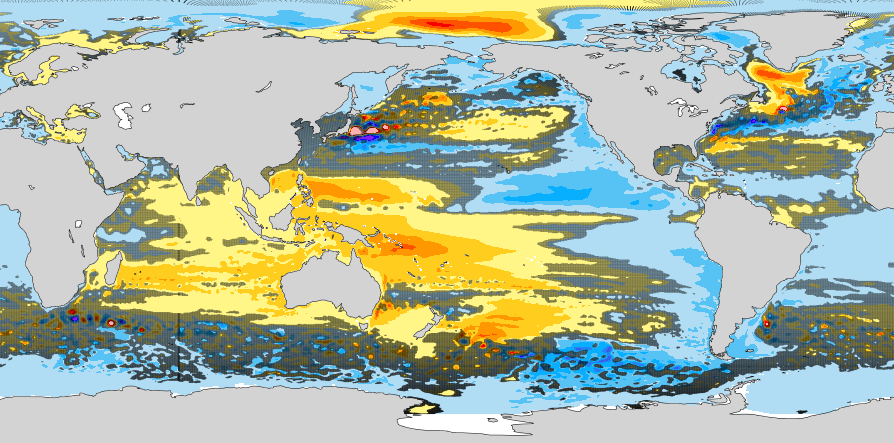
Regional sea level trends present large spatial patterns caused by natural variability (changes in winds, air-sea flux etc.) along with anthropogenic influences in the atmosphere. These sea level trends can be partially masked by random oceanic processes.
Global mean sea level rise is one of the most direct consequences of the on-going global warming. Based on satellite altimetry data, global mean sea level rise has been estimated to be 3.3 mm/yr since 1993. For the first time and thanks to the high quality satellite altimetry records, a large regional variability has been highlighted with regions experiencing a sea level rise 3 times faster than the global average. This regional variability can differ from place to place and over different time periods.
An ensemble of ocean model simulations show that atmospherically-forced regional sea level trends (e.g., through changes in winds, air-sea exchanges etc.) can be partly (within an estimated 38% – 47% range depending on the timeframe considered) masked out by spontaneous chaotic ocean variability. Llovel et al. [2018] show that the chaotic ocean variability is particularly important in the strong flows such as the western boundary currents and the Antarctic Circumpolar Current where chaotic eddies are commonly found. Although the intrinsic ocean variability appears stationary over the same time span, the atmospherically-forced regional sea level trends can differ significantly from one period to another. This suggests that long-term measurements from satellite altimetry (more than 23 years) are needed in these regions to disentangle the atmospherically forced response versus the chaotic variability for the regional sea level trends over the altimetric period and therefore the importance to extend the satellite altimetry records.
While not questioning the ongoing global warming indicated by global and regional sea level trends, this study sets new constraints on the measurement time required to attribute regional sea level trends to the atmospheric forcing or to climate change.

Citation: Llovel, W., Penduff, T., Meyssignac, B., Molines, J.‐M., Terray, L., Bessières, L., & Barnier, B. [2018]. Contributions of atmospheric forcing and chaotic ocean variability to regional sea level trends over 1993–2015. Geophysical Research Letters, 45. https://doi.org/10.1029/2018GL080838
Acknowledgement: This work is a contribution to the OCCIPUT (ANR, France) and PIRATE (CNES, France) projects and is supported by the “Louis Gentil‐Jacques Bourcart” fellowship from the French “Académie des Sciences” and by the ESA Living Planet Fellowship OVALIE Project.
Contact: William Llovel, LEGOS (Toulouse, France), william.llovel@legos.obs-mip.fr; +33561332930