Certainly not according to available data.
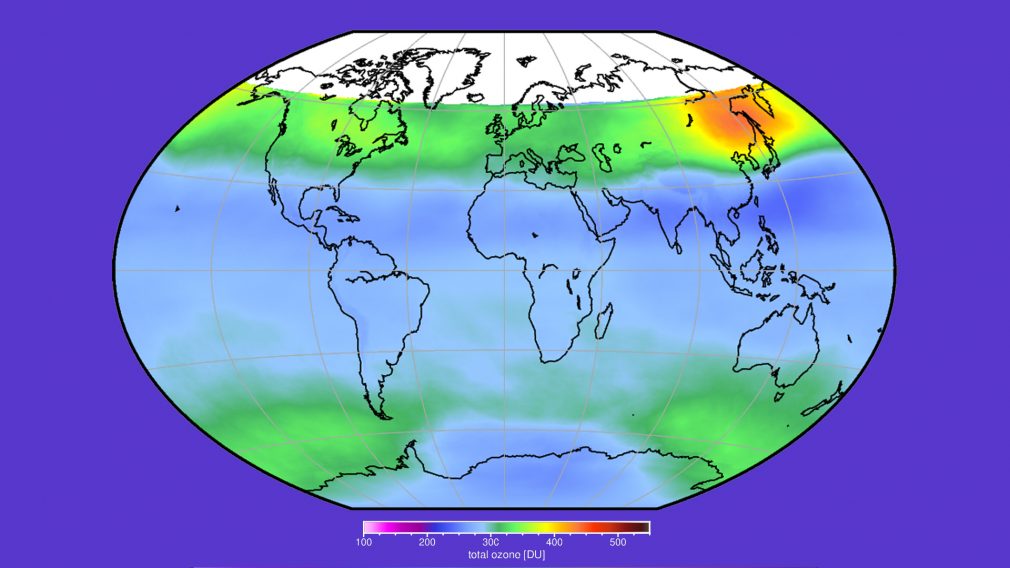
The claim of a so called “ozone hole” in the tropical lower stratosphere, “seven times larger in area than the one over Antarctica” (see Fig. 1), was made by a – highly controversial – paper (Lu, 2022). The study used data from the smoothed and gap-filled version of the Trajectory-mapped Ozonesonde dataset for the Stratosphere and Troposphere (TOST_SM) to identify and label such a tropical ozone hole as large and all-season.
Subsequent investigations (Chipperfield et al, 2022) into this topic, using the same dataset, clearly rebut this claim.
A tropical ozone hole thesis
The paper Observation of large and all-season ozone losses over the tropics, published by Lu in 2022 on AIP Advances, claims two main assertions:
- substantial datasets of the troposphere–stratosphere ozone climatology since the 1960s, latitude–altitude CFC distribution, time-series total ozone, Ozonesonde and Umkehr datasets, and lower stratospheric temperature climatology from multiple ground-based or satellite measurements have provided strong evidence of an existing whole-year ozone hole over the tropics (see Fig. 1).
- both the Antarctic ozone hole and the tropical ozone hole must arise from an identical physical mechanism, and the cosmic-ray-driven electron reaction model (CRE mechanism) has provided the best predictive model that shows good agreement with observations.
Only a small ozone loss trend
A very large amount of active research is being performed on the ozone layer. A summary of this international effort is given every four years in the WMO Ozone Assessment, the most recent being WMO (2022).
As described in this scientific report, the observed stratospheric ozone depletion has been widely explained through a well-established gas phase and heterogeneous chemistry following the emission of ozone-depleting substances (ODSs) through human activities. Factors other than chemical depletion that also contribute substantially to long-term changes in ozone (e.g., solar variability and atmospheric dynamics/circulation) have been successfully identified and are well documented in the scientific literature. Moreover, as described in the same WMO Ozone Assessment, several studies have reported signs of ozone recovery above polar areas, in line with the human-induced (and human-healed) theory associated with the polar holes. This would not be the same within a CRE mechanism context.
The same WMO (2022) compilation of international research indicates that lower stratospheric ozone currently shows small negative trends in the tropics and at middle latitudes. This is very different from the year-round, large ozone hole mentioned by Lu.
Why is it so? According to the investigations reported in Observation of large and all-season ozone losses over the tropics by Chipperfield et al. (2022) this resides in Lu’s erroneously large tropical ozone value estimates in the interpolated sparse historical TOST data.
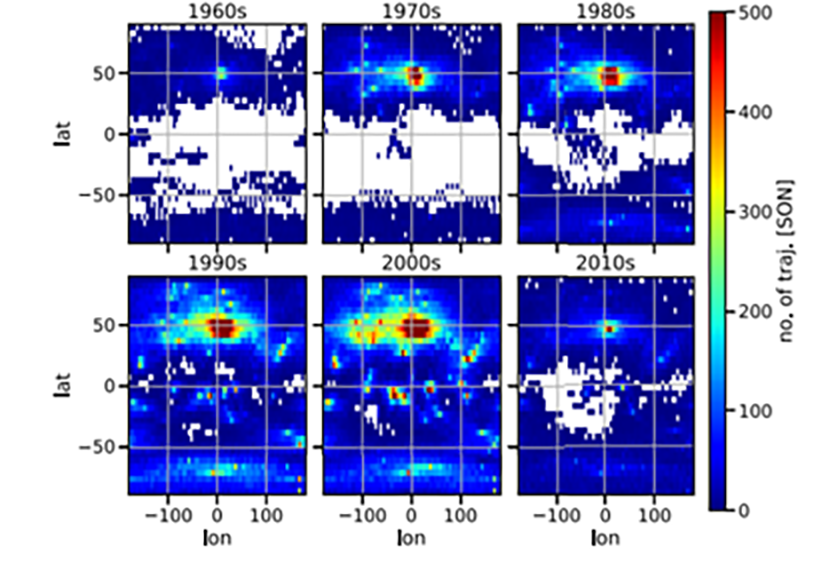
Figure 2 shows the coverage of the raw trajectory-extended ozonesonde data used to create the TOST datasets. The observed data coverage in the tropics is poor from the 1960s to the 1980s, which affects the validity of the data created by the TOST_SM gap-filling algorithm. Moreover, in the southern tropics (20°S–0°), where the largest ozone depletion was reported by Lu (2022), the only observations in the 1960s are from 1965, and the data coverage was very sparse until the late 1980s. The gap-filling procedure leads to typical mid-latitude ozone values generally higher than in the tropics to fill the gaps before the 1990s, thus suggesting a more dramatic ozone decline until today (Fig. 1). The lack of tropical ozonesonde observations is one severe limitation to diagnosing ozone changes in this region from a decade before the 1990s.
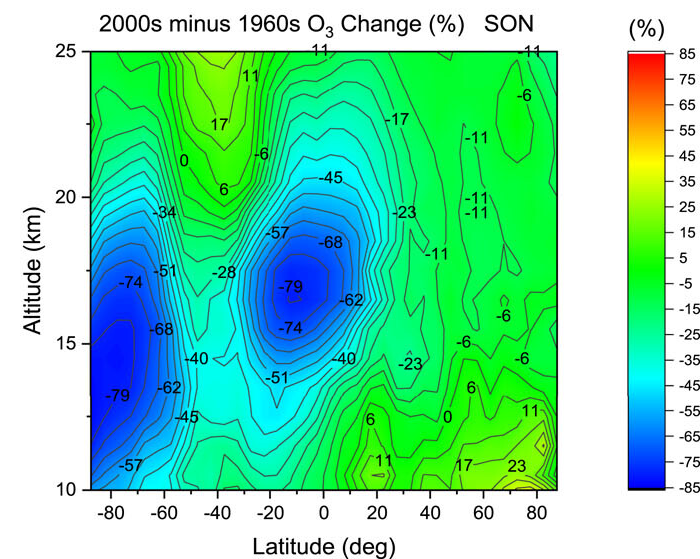
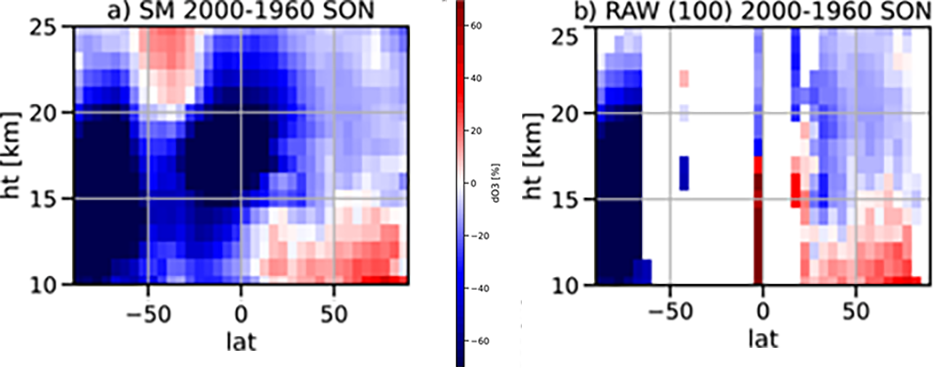
Figure 3 shows the differences between the TOST gap-filled dataset (TOST_SM) and TOST raw dataset (TOST_RAW) decadal means for the September–October–November (SON) season between the 2000s and 1960s. In addition to the simple difference between the TOST_SM decadal means (Fig. 3a), the next image (Fig. 3b) shows the decadal mean differences with the TOST_RAW data but filtered to only include grid cells with a minimum number of 100 data points in the calculation of the decadal mean zonal mean. A total of 100 data points in an atmospheric region of 5o latitude × 360o longitude × 1 km altitude over 10 years is still a very sparse coverage. As in Figure 1, Figure 3a shows an apparent large depletion of ozone in the TOST_SM data of up to 80% since the 1960s at around 17.5 km altitude and in the latitude range 20°S–0°. However, this change in the smoothed and gap-filled TOST_SM data is an artefact of the sparsely sampled tropical region without a robust link to the available observations. In Figure 3b the TOST_RAW data do not show such a large ozone decline, and ozone even increases below 18 km.
The importance of international cooperation
As discussed above and supported by extensive literature, there is no robust, credible observational evidence for substantial ozone depletion (i.e., an “ozone hole”) in the tropics. It is well known that climatological total ozone in the tropics is much lower than that in the mid-latitudes. Satellite and ozonesonde measurements indicate a decline of 3%–5% per decade for tropical lower stratosphere ozone before 2000 (WMO, 2022).
Ensuring the use and interpretation of datasets do not have such major flaws is a lesson learnt from this tropical ozone hole experience. The best approach to remove such a risk is for data analysts to work collaboratively with the international research teams responsible for obtaining the data.
Featured image: Total ozone from TROPOMI in December 2022.
References
Lu, Q.-B., Response to “Comment on ‘Observation of large and all-season ozone losses over the tropics’” [AIP Adv. 12, 075006 (2022)], doi: 10.1063/5.0129344, 2022
Chipperfield, M.P., A. Chrysanthou, R. Damadeo, M. Dameris, S.S. Dhomse, V. Fioletov, S.M. Frith, S. Godin-Beekmann, B. Hassler, J. Liu, R. Muller, I. Petropavlovskikh, M.L. Santee, R.M. Stauffer, D. Tarasick, A.M. Thompson, M. Weber and P.J. Young, Comment on “Observation of large and all-season ozone losses over the tropics” [AIP Advances 12 075006 (2022)], AIP Advances, 12, 129102, doi:10.1063/5.0121723, 2022.
Lu, Q.-B., Observation of large and all-season ozone losses over the tropics, AIP Advances, 12, 075006, doi:10.1063/5.0094629, 2022.
World Meteorological Organisation (WMO). Executive Summary. Scientific Assessment of Ozone Depletion: 2022, GAW Report No. 27, WMO Geneva, 2022. https://ozone.unep.org/system/files/documents/Scientific-Assessment-of-Ozone-Depletion-2022-Executive-Summary.pdf