While waiting for the upcoming news on the next RACE challenge, expected on 1 August, let’s take a look at the March challenge winner story.
Challenge #1 question was: How does the pandemic affect shipping traffic and related air and water quality?
Alessandro Cimbelli, the selected winner, a technologist at ISTAT (Italian institute of statistics), decided to focus his reply on big oil tankers anchored off the main European hub – Amsterdam-Rotterdam-Antwerp – by looking at Sentinel-1 and Sentinel-5P data available via the Euro Data Cube and the RACE dashboard.
Due to the COVID-19 pandemic, most of European countries went into lockdown during April 2020. With transport coming to a halt, the demand for fuel collapsed. Onshore tanks in the main storage hubs remained full, and the oil tankers could not discharge their load, hanging anchored in ports as “floating storage”, waiting to sell their cargo.
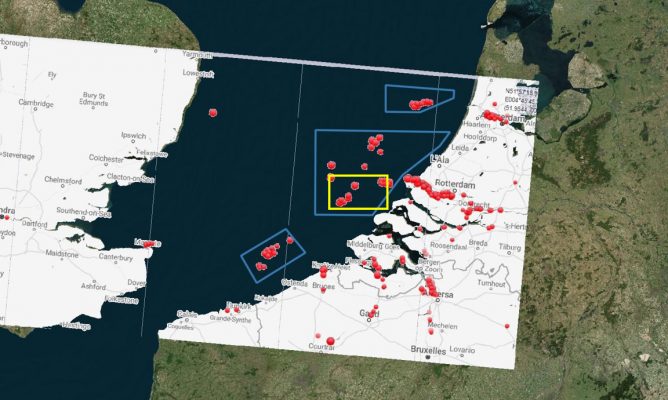
The following map, showing AIS-located tankers and cargo, gives an idea of the number of such vessels anchored in the English channel and highlights in the yellow frame the processed area of interest.
Within his Jupyter Notebook solution, Alessandro analysed all 2020 Sentinel-1 VH band data in order to:
- detect ships in the area
- select only large (i.e. tankers/cargo) vessels by looking at the length of the detected objects
- filter out “noise” by calculating a monthly average.
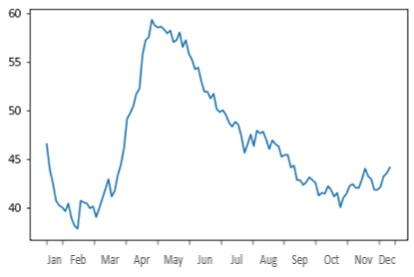
The following image shows the trend for the number of counted anchored vessels throughout the year. The peak is clearly reflecting the lockdown impact.
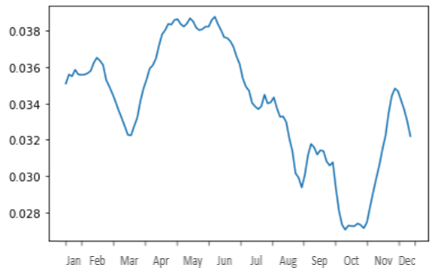
Besides counting the vessels, Sentinel-5P CO maps were analysed in a similar manner (applying the monthly averaging) and cross-correlated with the vessel counts with interesting results (0.66 correlation coefficient between the number of vessels and S5P CO measurements during 2020).
After winning the first 1000 euros for prototype development, Alessandro submitted an upscaling proposal and is currently working on applying the idea to an enlarged AOI (all major European ports) using the awarded Euro Data Cube enterprise license. Additionally he is enriching the correlation analysis by taking into account new resources now available from the Euro Data Cube, i.e. water quality parameters (chlorophyll, sediments and water turbidity) from Sentinel-3 OLCI.
Good luck for the next challenge segment!
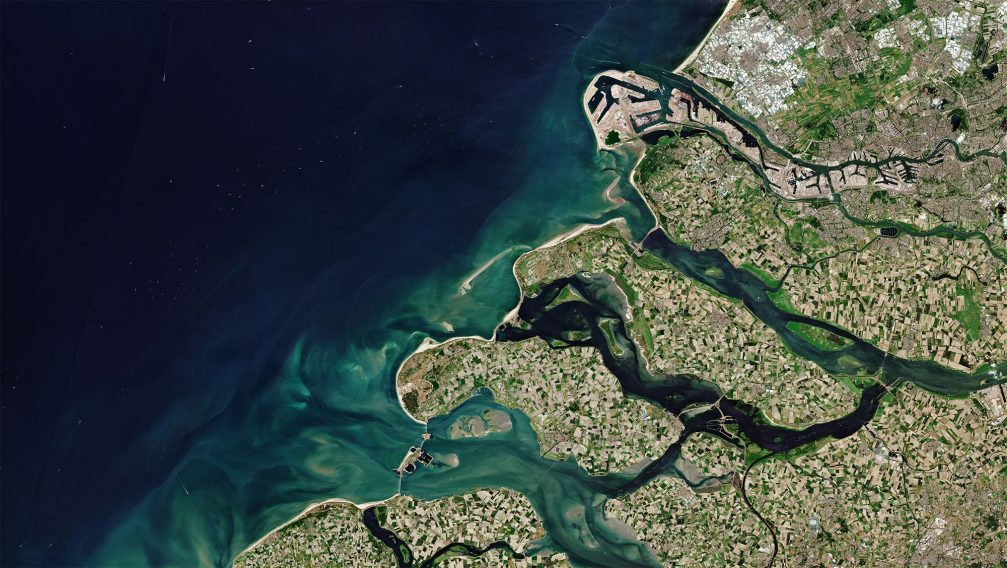
Featured image : Sentinel-2 acquisition on 30 May 2020 over Zeeland, Netherlands. Contains modified Copernicus Sentinel data (2020), processed by ESA, CC BY-SA 3.0 IGO