The Rapid Action on COVID19 with Earth Observation (RACE) initiative – launched in spring 2020 by ESA and the European Commission (EC) – has been looking at EO contributions to monitoring and understanding the impacts of the pandemic on society, in particular on economy and the environment.
RACE initiative and dashboard are ongoing and community contributions play an important role. The RACE dashboard challenges are regularly proposed to anyone with innovative ideas to discover new ways of monitoring the impacts of the pandemic.
The RACE dashboard
Outcomes of the investigation to date are readily available in the RACE dashboard, an interactive visualization and analysis environment with an ever growing display of indicators describing the status of different components in sectors such as economy, agriculture or air and water quality during the pandemic.
Besides data collected through a joint effort of industrial and academic partners, the dashboard features two community-contributed indicators (truck and airplane traffic) that are the outcome of the COVID19 scripting contest conducted throughout 2020, upscaled at European level and integrated.
New challenges 2021
In analogy with the mentioned COVID19 scripting contest, new challenges are being released throughout 2021 and outcomes will eventually enrich further the RACE dashboard.
The final goal of each challenge is the development of new indicators to be integrated into the RACE dashboard. Full credit and IPR stay with the developer, whose results will have high public visibility and might be the start of a success story!
Find in the gallery below a live collection of links to the 2021 single challenge announcements as soon as they are released.
Who can apply
This is an opportunity for anyone, regardless of the background and nationality: there is no specific requirement to comply with, no complicate procedure to participate and submit ideas.
Participation of small interdisciplinary teams (e.g. coder, EO/geo-information expert, thematic specialist) is welcome and encouraged.
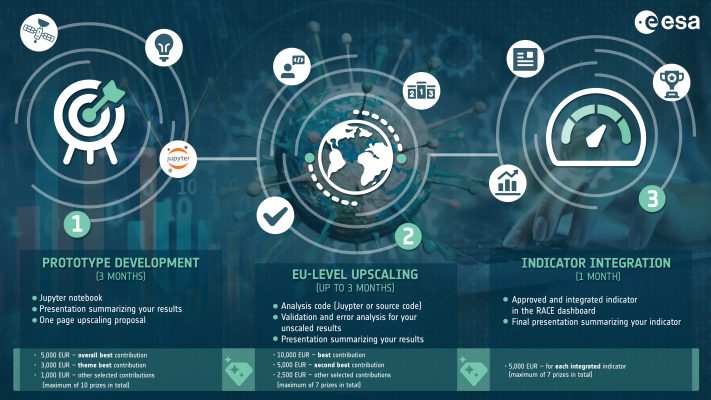
Gain economic rewarding (up to 20,000 EUR for the best indicator after the 3 stages of participation described below) and large public visibility at EU level: both ESA and EU will promote successful proposals!
Roadmap/stages for each challenge (updated procedure)
(click on + sign for details)
Technology, data and support
Hosted Jupyter notebooks in EuroDataCube will be the main technological interface for development, providing participants with intuitive access to the Sentinel data archives as well as the layers and indicators in the RACE dashboard.
Tutorial notebooks have been prepared to guide participants on how to access data, how to use GeoDB to store and retrieve indicator statistics and how to ingest additional datasets necessary for the analyses.
Feedback on initial ideas will be provided by ESA at any time. Simply send a 1-2 slides to the RACE email address below and add some questions you might have.
In addition, we will offer participants a training on the use EDC resources and hold a dedicated Q&A webinar. Details on these will be posted here and communicated to participants via email.
Evaluation
The following key criteria will be considered for the challenges during each stage of the evaluation:
- Innovation
- Cross Disciplinary Value
- Scientific integrity & validation
- Upscaling potential
- Joint use of EO and other datasets (e.g. Copernicus Services)
- Policy Relevance
How to participate
Sign-up for the challenge on this page. After signing-up you will receive an email from EuroDataCube with tailored instructions.
For any query, please refer to the following e-mail addresses:
- all technical issues – racecontest@eurodatacube.com
- more general questions – eodash@esa.int
Stay tuned and follow forthcoming news on eo4society.esa.int page, as well as the hashtag #eodash on social media (in particular, @EO_OPEN_SCIENCE and @ESA_EO Twitter accounts).


