Launched in June 2024, JupyterGIS was introduced as a collaborative, web-based GIS environment built on the JupyterLab framework. Its objective is to bring QGIS-inspired workflows into the browser, enabling real-time collaborative editing, seamless integration with notebooks, and support for core geospatial data formats.
When it was first announced earlier this year, JupyterGIS already delivered:
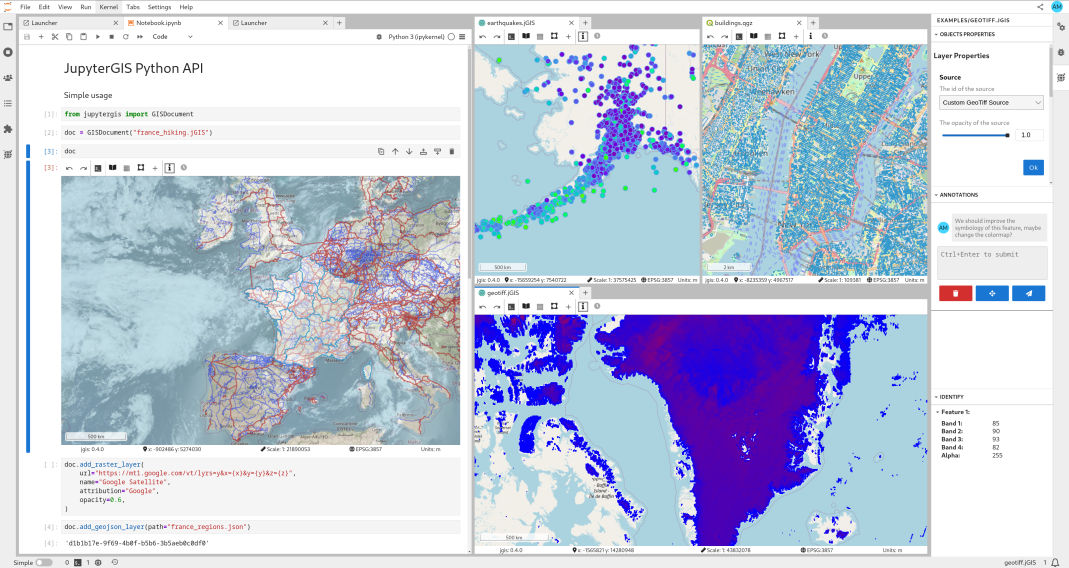
- Real-time collaborative editing (Google Docs-style)
- Visualisation of raster & vector data
- Symbology editing and spatio-temporal animations
- Programmatic map control via a Python API.
Thanks to contributions from the community and support from partner organizations, JupyterGIS has advanced significantly and now offers an expanded range of features for analysis, visualization, and collaboration.
Enhanced vector tile capabilities
Support for vector tiles has been strengthened, including full compatibility with the pmtiles format.
Other key updates include:
- An identify tool that inspects vector tiles to display features and associated properties.
- A symbology panel that applies graduated, categorized, and canonical symbology to vector tile layers.
These improvements enhance the interpretability and styling of geospatial datasets directly in the browser.


A new processing toolbox
One of the most significant updates is a new browser-based processing toolbox powered by a WebAssembly (WASM) build of the Geospatial Data Abstraction Library (GDAL).
Available tools include:
- Buffer: computes a buffer around geometries of a vector dataset.
- Convex Hull: calculates the convex hull for each feature of an input layer.
- Dissolve: combines features of vector layers into new features
- Bounding Boxes: calculates the bounding box for each feature in an input layer.
- Centroid: creates a new layer with the centroids of the geometries of an input layer.
- Concave Hull: computes the concave hull for each feature of an input point layer.
This toolbox has been designed for extensibility, with a JSON schema that allows additional GDAL operations to be integrated in a straightforward manner.

Symbology enhancements
Visualization of geospatial data has become more flexible and expressive through several enhancements:
- Viridis is now the default colormap, providing perceptually uniform visualization.
- Multiband symbology is now available for GeoTIFFs.
- Canonical symbology defined in GeoJSON files can be applied automatically.
- Colormaps can now be reversed, allowing greater flexibility for data interpretation and visualization.
- In the case of point layers, color and marker size can be styled independently, and bound to different data.

Integration with SpatioTemporal Asset Catalogs (STAC)
A SpatioTemporal Asset Catalog (STAC) browser is now embedded into JupyterGIS, streamlining access to different data collections. Users can select specific platforms and sensors, choose data products and processing levels, and set temporal and spatial constraints.
It is now possible to search across multiple datasets simultaneously. Users can click on any result to add it directly as a layer to their JupyterGIS project. This creates a seamless workflow from data discovery to visualization, making it easier for researchers and analysts to find and integrate relevant satellite imagery and geospatial datasets into their Jupyter notebooks.
Currently, the STAC Browser only supports the Geodes STAC API but support for all STAC catalogs is under way.

Support for more data types
The range of supported geospatial data formats is now broadened with GeoParquet and PMTiles, enabling efficient columnar storage and fast analytical queries for GeoParquet, and highly compact, streaming-friendly vector tile delivery for PMTiles.
User experience and interface improvements
The interface has been refined for a smoother workflow:
- Integrated control panels (layer list, filters, layer properties, etc.), reducing back and forth between the JupyterLab side-panels and the JupyterGIS UI. It also improves the “single document” scenario, allowing it to interact with JupyterGIS controls when opening a GIS document from the classic Jupyter Notebook UI.
- An improved toolbar design, with cleaner icons and better usability.
- A new feature to center the map on your current location.
- Map annotations now link to the map: clicking an annotation automatically re-centers and zooms to the location.
- Full-screen mode support.
Legends for vector layers
JupyterGIS now automatically generates legends for vector layers, ensuring consistent interpretation:
- Legends are dynamically updated to reflect current symbology.
- Customizations such as reversed colormaps are preserved.

JupyterGIS tiler extension
An extension for JupyterGIS enables the creation of JupyterGIS layers from xarray variables in Jupyter kernels, with support for lazy evaluation, bridging geospatial workflows with powerful array-based computation.
The package, called JupyterGIS-tiler, is available in GitHub here and can be installed from PyPI with pip install jupytergis-tiler.
Looking ahead
Development will continue to expand JupyterGIS in several directions:
- Extension of the GDAL-based processing toolbox.
- Deeper integration with QGIS and a richer Python API for automation.
- A Story Maps Editor and Viewer to enable interactive communication of geospatial information through text, imagery, and maps.
In the meantime, feel free to try JupyterGIS directly in your browser with JupyterLite, no installation required.
Opportunities for engagement also include:
- Checking out documentation for tutorials and the Python API.
- Discussions via the GeoJupyter Zulip channel or the bi-weekly GeoJupyter hackathon.
- Contributions to the development repository.
The JupyterGIS community continues to grow, and active participation from researchers, developers, and educators worldwide is encouraged.