When the ground trembles during a powerful earthquake, the danger doesn’t end once the shaking stops. Hidden threats like landslides and floods often emerge later, putting lives and infrastructure at risk weeks, months, or even years after the main event.
The knowledge gap
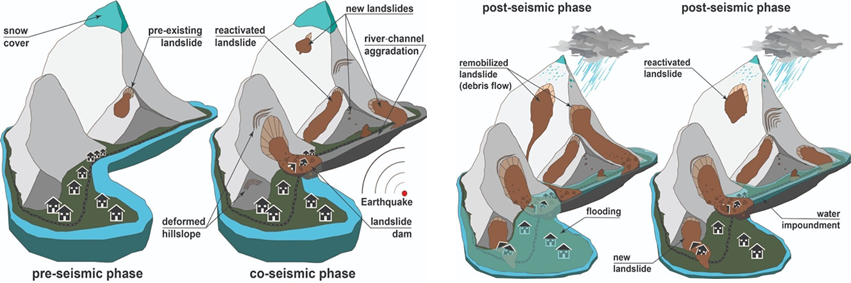
Collapsed buildings and fast-moving landslides make headlines, but earthquakes destabilise far more than what we see right away. Slopes destabilized by seismic shaking can slowly accelerate, eventually causing delayed landslides or floods. These long-term hazards remain poorly understood.
While much of today’s research focuses on co-seismic landslides (those that happen immediately during the quake), the AMHEI (Advancing knowledge of multi-hazards processes and their impact) project aims to uncover how slopes evolve in the months and years following a major earthquake, and how these changes might influence landslide and flood hazards.
The Türkiye–Syria case study
A devastating sequence of earthquakes in the Türkiye–Syria region killed more than 55,000 people in 2023 and affected an area the size of Germany (~350,000 km²). This was the region’s most severe natural disaster in two decades. The impact of the event includes nearly 50,000 buildings collapsing in Turkey and Syria, with more than 15 million people affected, and a series of additional hazards stemming from the February 2023 earthquake sequence.
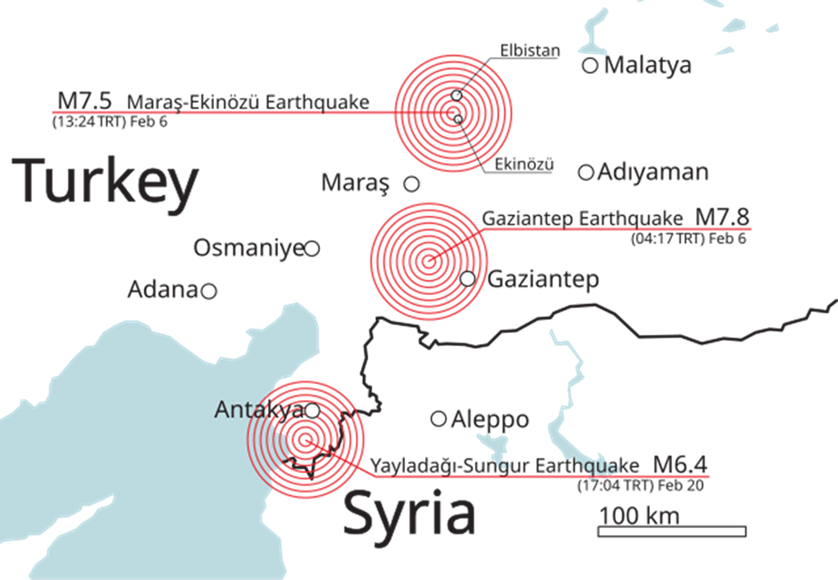
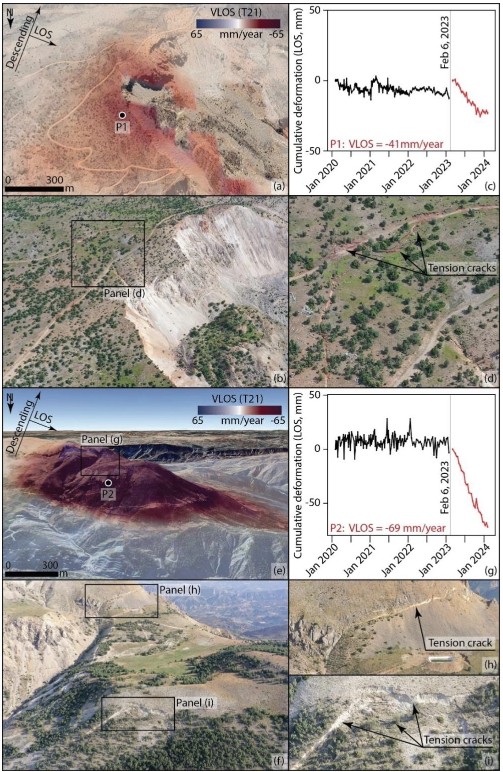
Researchers investigated the regional impact of the February 6, 2023, Kahramanmaraş earthquake sequence on slow-moving landslides across ~66,800 km² in southeastern Türkiye.
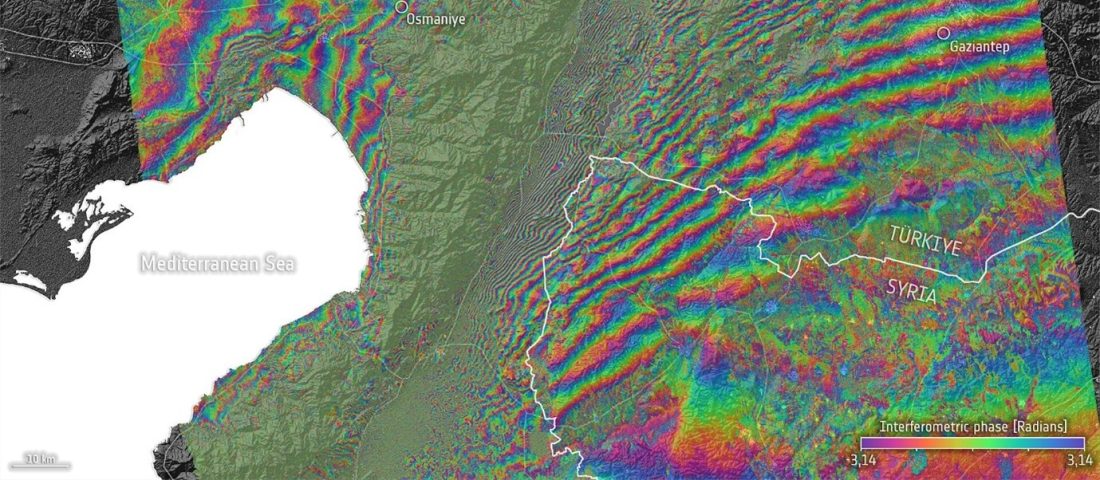
Using Sentinel-1 InSAR time series from three years before to one year after the earthquakes, the researchers applied convolution-based filtering to isolate landslide-related deformation from tectonic signals. Due to the lack of ground validation, high-resolution optical imagery was used to verify deformation sites and assign confidence levels.
Key findings from this work so far are:
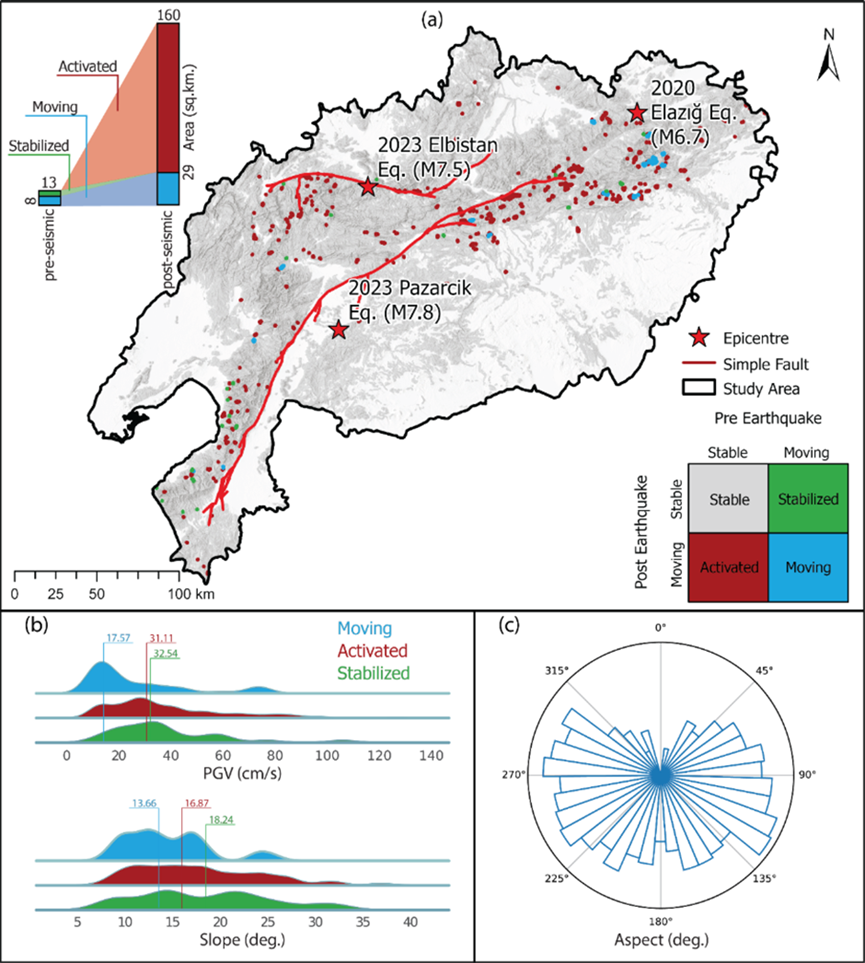
- Nearly 131 km² of slopes showed new deformation after the earthquakes, especially close to (< 20 km) active fault lines.
- Around 4.6 km² of terrain stabilised, likely due to slope failures reducing stress.
- The total area affected by slow-moving landslides expanded from 12.4 km² before the quake to 159.4 km² after: an almost 13-fold increase.
These results show that earthquakes tend to activate or reactivate far more landslides than they stabilise.
These findings underscored the dual impact of strong earthquakes on hillslope dynamics and highlight the need for long-term monitoring to assess evolving landslide hazards.
Why it matters
Traditionally, landslide hazard maps are static snapshots. AMHEI is pioneering dynamic, time-series-based maps that reveal how risks change over time. This innovation is meant to provide a clearer, evolving picture of threats, helping communities, planners, and responders prepare more effectively.
Next, AMHEI will explore the landslide–flood connection, giving a fuller picture of cascading hazards in vulnerable regions.
Featured image : Türkiye–Syria interferogram. Contains modified Copernicus Sentinel data (2023), processed by ESA, CC BY-SA 3.0 IGO.