The anthropogenic emissions of methane (CH4), after those of carbon dioxide (CO2), are the second most important man-made source of greenhouse gases contributing to global warming. Over a 20-year timescale, each kilogram of methane emitted has a global warming potential more than 80 times more potent than carbon dioxide. Reducing methane emissions would help to reduce global warming.
At the Dubai COP28 climate conference in December 2023, many countries committed to work together to reduce collectively methane emissions by at least 30% of those in 2020 by 2030 as part of the Global Methane Pledge.
Achieving this goal requires identifying major methane sources and monitoring emissions reduction. Earth Observation (EO) measurements of methane are an important information source for such tasks.
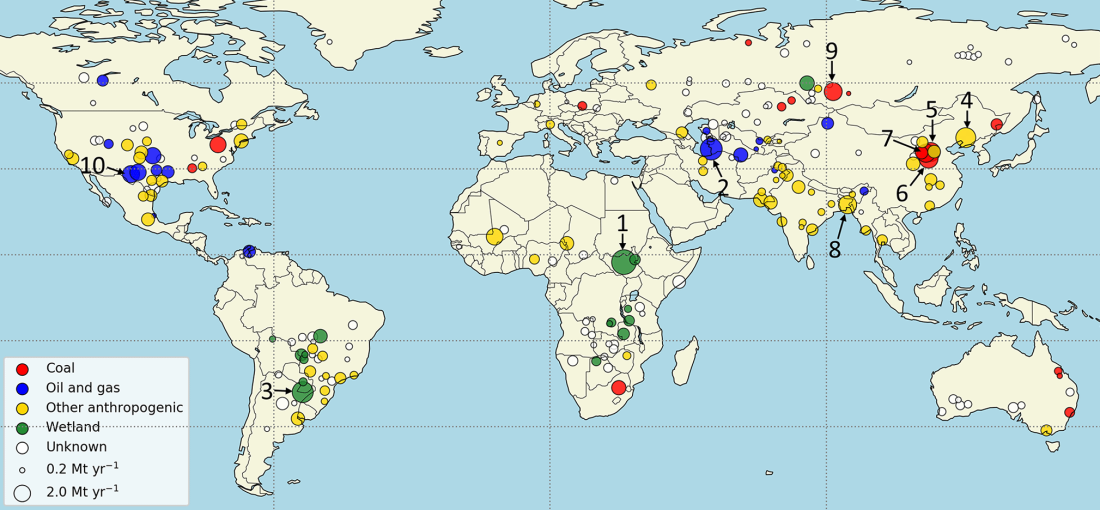
A recently published scientific study uses TROPOMI data from the Sentinel-5 Precursor (S5P) satellite to automatically determine methane concentrations and identify regions of persistent methane concentrations. This study identified 217 major potential methane source regions, estimated their emissions and created a global map of their distribution, shown in the figure above.
The XCH₄ metric to analyse methane concentration
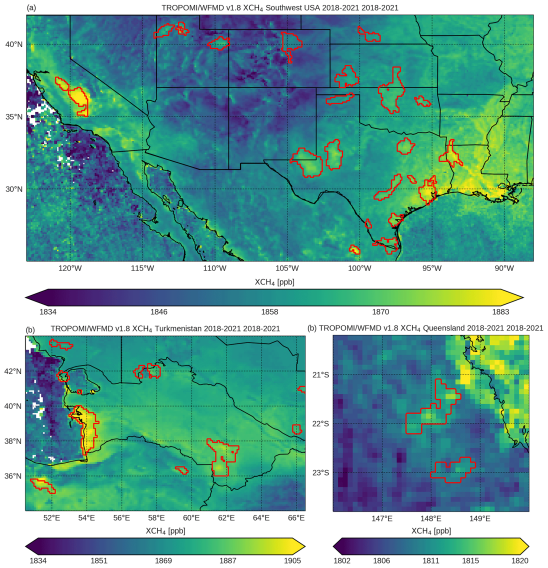
For identifying the methane sources, the study used a new methane concentration data set derived from the TROPOMI instrument using an algorithm developed at the University of Bremen in the framework of the ESA GHG-CCI project. The retrieved concentration, XCH4, is the column-averaged dry-air mole fraction of atmospheric methane and is reported as a mixing ratio, having units of parts per billion, ppb of air (nmol mol-1). A value of 1870 ppb at a given location (see figure below) means that the air above that location contains 1870 methane molecules per 1 billion air molecules (excluding water vapour molecules).
To identify major source regions, XCH4 monthly maps at 0.1 degrees spatial resolution (approximately 10 km) were generated and analysed for the period 2018-2021. A source region was classified as a (potential) persistent emitter if the detected XCH4 values were consistently elevated compared to its surrounding areas. Quality filtering ensured accuracy but introduced data gaps, where and when the presence of clouds obscured observations.

Identified methane emission sources
The study pinpointed 217 potential methane source regions worldwide. These were classified by the emission type, determined from comparisons with the known emission databases:
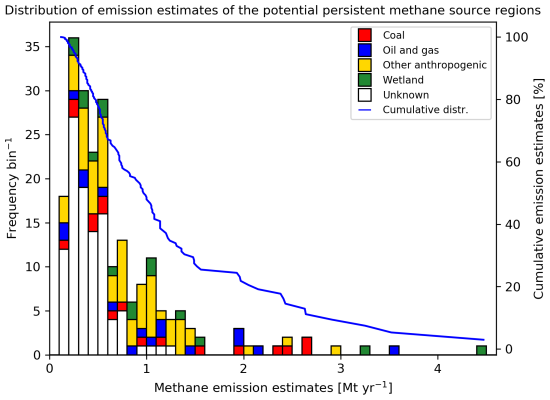
- Natural sources: wetlands are the most important natural methane emitters. The South Sudan Sudd wetland region is the largest estimated emission source shown in the graph below and is the region or area #1 in the header image map.
- Anthropogenic sources: they include oil and gas, coal mining, landfills and other human activities. The second-largest emitter is an oil and gas hub on the west coast of Turkmenistan (blue square in the graph and area #2 on the map).
Unclassified sources (white) represent smaller or ambiguous regions, requiring further study. The top 10 emitting regions are discussed in detail in the paper, but the full catalogue needs expanded analysis, which includes detailed comparisons with results obtained from other satellites as planned in SMART-CH4 and MEDUSA ongoing projects.

Conclusion and future steps
The exploitation of existing satellite data to obtain improved information on methane sources is a highly active research area and the focus of several projects such as ESA GHG-CCI, MEDUSA and SMART-CH4 or EU project EYE-CLIMA.
Satellite data are already being used in international initiatives, such as UNEP’s International Methane Emissions Observatory (IMEO), which focuses on methane mitigation actions.
While in recent years it has been demonstrated that methane information can be derived from several satellites not specifically developed for such an application, new satellites developed for methane monitoring have been launched in 2024 and Europe is preparing CO2M, a constellation of three satellites. The objective of CO2M focuses on the measurement of XCO2 but it will also provide high-quality information on methane at significantly higher spatial resolution than TROPOMI.
These innovative missions in an evolving global observing system will enhance our understanding of the various and changing anthropogenic and natural methane sources in support of the goals of the Global Methane Pledge.
Read also the story published on ESA EO pages.
Vanselow, S., Schneising, O., Buchwitz, M., Reuter, M., Bovensmann, H., Boesch, H., and Burrows, J. P.: Automated detection of regions with persistently enhanced methane concentrations using Sentinel-5 Precursor satellite data, Atmos. Chem. Phys., 24, 10441–10473, https://doi.org/10.5194/acp-24-10441-2024, 2024.
Featured image : Map of identified potential persistent methane source regions. The top 10 locations are highlighted with numbers from 1 to 10 and are discussed in detail in Vanselow et al., 2024

