The Greenland Ice Sheet is one of the biggest contributors to global sea level rise and, as the polar climate warms, this contribution is increasing. The decrease in the mass of the ice sheet is split approximately evenly between runoff of meltwater and flow of Greenland’s glaciers into the ocean. ESA’s 4DGreenland project aims to use satellite observations to better understand the meltwater budget of the Greenland Ice Sheet.
The latest results from 4DGreenland have been published this week in two articles in The Cryosphere. The articles highlight how satellite Earth Observation can be used to improve understanding of dynamic meltwater processes in Greenland, both at the surface and base of the ice sheet.
Lakes on the ice sheet surface
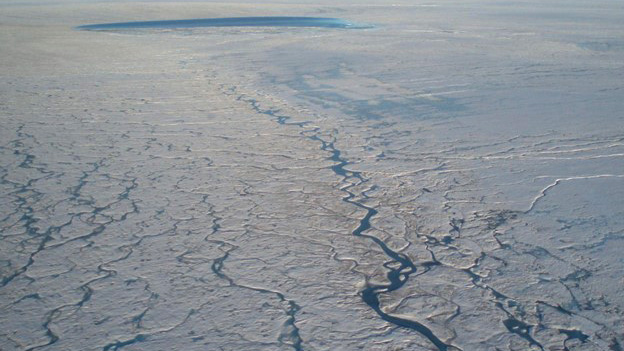
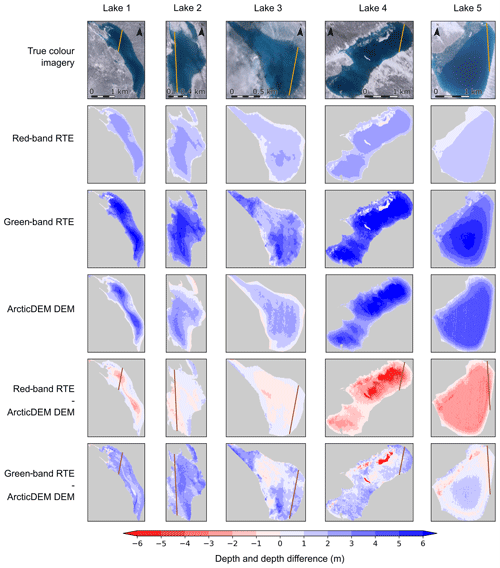
During the summer months, water accumulates in depressions on the surface of the Greenland Ice Sheet, forming a dense network of lakes and streams. Despite their importance, routine monitoring of all of Greenland’s surface lakes is a monumental task. The ice sheet spans an area of over 1.5 million square kilometers, and lakes can form around a broad swath of the ice sheet margin. As a result, comprehensive surveys are only feasible using space-based observations, such as those acquired by the Copernicus Sentinel-2 satellites. Whilst techniques for mapping lake area using these data are well-established, determining lake depth and volume remains a challenge. This limits our ability to confidently track the total volume of water stored atop the surface of the ice sheet.
This new study, which was led by Lancaster University (UK), used Sentinel-2 data, in combination with ArcticDEM digital elevation models and NASA’s ICESat-2 laser altimeter, to evaluate different methods for retrieving lake depth estimates from satellite Earth Observation data. Laura Melling (Lancaster University), lead-author of the study, says “Monitoring these lakes, together with the volumes of water that they store and release, is important for understanding the longer-term fate of the ice sheet and tracking the accelerating delivery of meltwater to the ocean. This study also demonstrates the critical role that Earth Observation plays in understanding the response of the polar ice sheets to climate change. ”
Lakes beneath the ice sheet surface
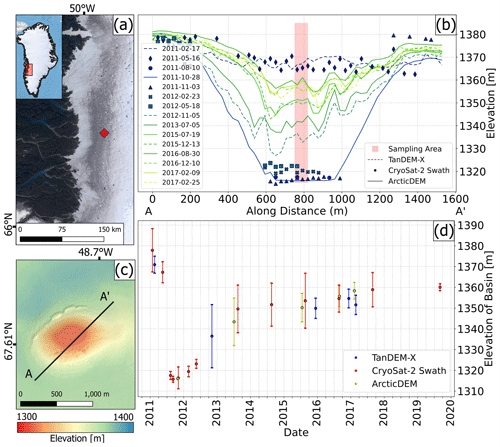
Meanwhile, at the base of the Greenland Ice Sheet, at the interface between the ice sheet and the bedrock, there are large hidden lakes of meltwater. These subglacial lakes tend to drain sporadically, discharging large quantities of freshwater into the subglacial drainage system and leaving a large collapsed basin at the surface of the ice sheet. Little is known about subglacial lakes because they are hidden beneath hundreds of meters of ice, and most studies to-date have relied on surface elevation models from optical imagery, which were limited by winter darkness and cloud conditions, and provided discontinuous time series of the lakes’ behavior.
This latest publication describes new innovative methods for improved monitoring of active subglacial lakes, using the novel swath processing of ESA’s CryoSat-2 radar satellite data and TanDEM-X radar data. This approach greatly improves the temporal coverage of the lakes and overcomes the limitations of previous methods. Joint lead-author Rasmus Bahbah, from Geological Survey of Denmark and Greenland (GEUS), suggests, “These new methods could be used for operational monitoring of subglacial lakes, which would utilize the latest acquired CryoSat-2 data and provide the scientific community with prompt notifications if a lake drains.” These new methods will improve understanding of when and how subglacial lakes drain, and how they will impact the meltwater system of the Greenland Ice Sheet in the changing climate.
Both of these articles can be found at the open-access journal The Cryosphere.
Melling, L., Leeson, A., McMillan, M., Maddalena, J., Bowling, J., Glen, E., Sandberg Sørensen, L., Winstrup, M., and Lørup Arildsen, R.: Evaluation of satellite methods for estimating supraglacial lake depth in southwest Greenland, The Cryosphere, 18, 543–558, https://doi.org/10.5194/tc-18-543-2024, 2024.
Sandberg Sørensen, L., Bahbah, R., Simonsen, S. B., Havelund Andersen, N., Bowling, J., Gourmelen, N., Horton, A., Karlsson, N. B., Leeson, A., Maddalena, J., McMillan, M., Solgaard, A., and Wessel, B.: Improved monitoring of subglacial lake activity in Greenland, The Cryosphere, 18, 505–523, https://doi.org/10.5194/tc-18-505-2024, 2024.
Featured image : Meltwater streams and a supraglacial lake on the surface of the Greenland Ice Sheet . Photo credit: Mal McMillan, CPOM, Lancaster University