Currently we speak of the ‘golden age’ of Earth Observation (EO). Not only can we access a variety of data from heritage and current EO missions serving scientific and operational needs, new systems for monitoring our blue planet are constantly being planned, built, and sent into the Earth orbit. Regarding atmospheric science, a major step forward was the launch of the COPERNICUS Sentinel 5 Precursor (S5P) mission in October 2017. On-board is the TROPOMI instrument, which allows viewing and examining atmospheric processes with a much higher horizontal resolution than previous satellite observing system. However, this also imposes new challenges in the related fields of research and development.
Commonly, three types of data play a role within the study of the atmosphere. The so-called “data triangle” consists of model data, EO satellite products, and other types of measurements, e.g., obtained from remote sensing on ground- or air-borne platforms or in-situ measurements. Next to the vast amount of data being produced daily, the variety of data triggers the need for an efficient data access and analysis approach.
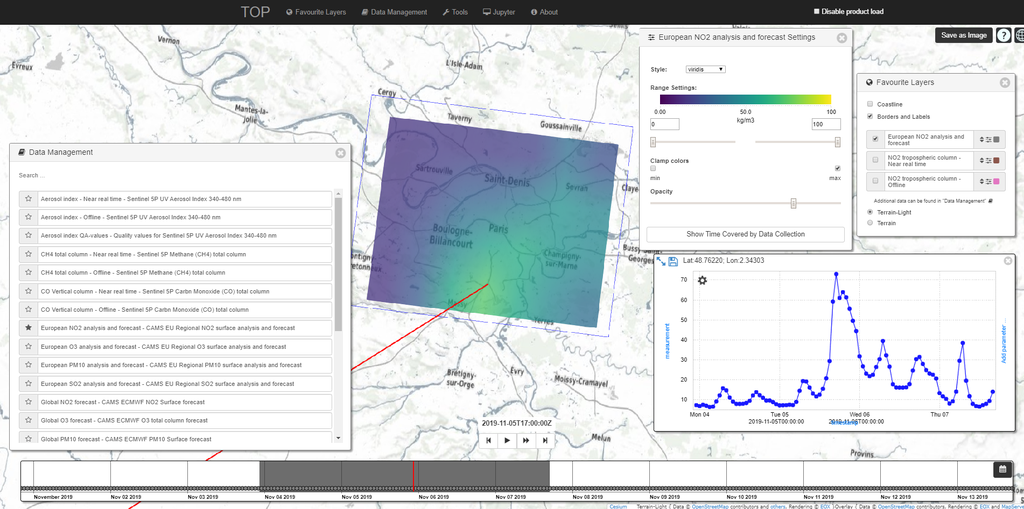
As of July 2019, the TOP VRE offers the following COPERNICUS Sentinel 5 Precursor products through MUNDI: UV aerosol index (UVAI), total column sulphur dioxide (SO2), total column nitrogen dioxide (NO2), total column methane (CH4), total column carbon monoxide (CO), and tropospheric ozone (O3). Furthermore, the following COPERNICUS Atmospheric Monitoring Services (CAMS) products are available: global analyses and forecasts and European ensemble analyses and forecasts for total column SO2, total column NO2, total column O3, and particulate matter (PM10; surface).
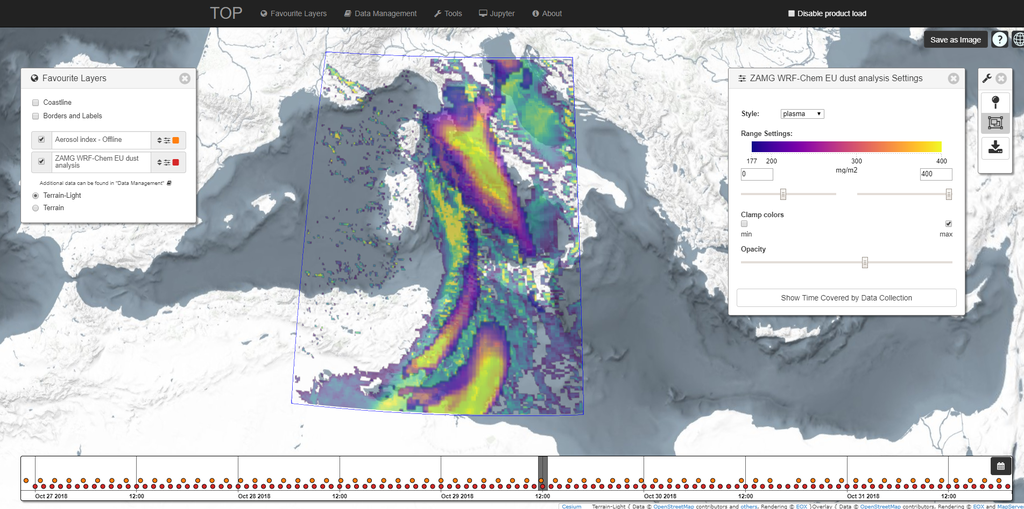
“We can use TOP to compare our WRF-Chem model output with S5P observations in a seamless and straight forward manner”, says Barbara Scherllin-Pirscher from the Central Institute for Meteorology and Geodynamics, Vienna (ZAMG). “Observations from the satellite were predicted by our model and both data sources are compared to each other using tools provided through web-technology”.
Visual data comparison is yet another application TOP is offering to its users. “The strength of TOP is that you do not have to worry about data preparation steps anymore. You want to work with atmospheric data from S5p and CAMS, chances are high TOP got you covered”, says Stefano Natali, project manager of TOP and managing director of SISTEMA GmbH, Vienna.
Next to the collaborative elements of the TOP platform i.e. enabling data exploitation and results sharing, the user can also request specific operational services, such as the delivery of periodic maps of atmospheric products from multiple sources.
TOP was first publicly presented at the General Assembly of the European Geosciences Union (EGU) 2019 in Vienna. Attracting a wide audience, the different ways of exploring and exploiting data, comparing model output with measurement data using either a GUI or the Jupyter notebook interface were presented. At the Living Planet Symposium 2019 in Milan, TOP had its second public appearance, giving potential interested users further insight into its potential. In June, 2019, a first interactive user workshop was held at ZAMG in Vienna, showing participants from the atmospheric science field as well as policy makers how TOP can facilitate their every-day work.
The TOP platform can be accessed via the dedicated website top-platform.eu.